What Is VWAP (Volume Weighted Average Price) and How Do Traders Use It?
 Published Sep 22, 2026
 Updated Sep 22, 2026
VWAP combines price and volume to show the average price paid during a trading session, giving traders a benchmark for intraday location and execution
- VWAP is a cumulative intraday average that gives more weight to prices where more volume traded.
- The indicator usually resets at the start of each session, so it is designed for intraday analysis rather than long-term trend measurement.
- Traders use VWAP as an execution benchmark, a trend reference and a potential area of support or resistance.
How Is VWAP Calculated?
Volume Weighted Average Price, or VWAP, answers a simple question: at what average price has the market traded today after accounting for volume?
A simple average gives every price observation the same weight. VWAP gives more influence to prices where more shares or contracts changed hands. A price reached on heavy volume therefore has a larger effect on the calculation than a price touched briefly on light volume.
The standard calculation multiplies price by volume for each interval, adds those values together, then divides by cumulative volume. Many charting platforms use the typical price of each bar, which is the high plus the low plus the close divided by three.
VWAP is cumulative. Each new bar adds price and volume information to the running calculation. Most standard VWAP indicators reset when a new trading session begins.
What Does a VWAP Calculation Look Like in Practice?
Assume a stock trades through three intervals. The first interval has an average price of $100 on 10,000 shares. The second averages $101 on 20,000 shares. The third averages $102 on 5,000 shares.
Price multiplied by volume equals $1,000,000 for the first interval, $2,020,000 for the second and $510,000 for the third. Total price-volume equals $3,530,000. Total volume equals 35,000 shares.
VWAP is therefore about $100.86.
The arithmetic average of the three prices is $101. The VWAP is lower because twice as much volume traded at $101 as at $100, while relatively little volume traded at $102. The calculation describes where the market actually did more business.
How Do Traders Use VWAP as an Execution Benchmark?
Institutional traders often use VWAP to judge execution quality. A buyer who fills below the session VWAP paid less than the market’s volume-weighted average price for that period. A seller who executes above VWAP received more than the benchmark.
That comparison is useful for large orders that cannot be completed in one print. An execution algorithm may spread orders through the day in an attempt to track or improve on VWAP while limiting market impact.
Retail traders can use the same concept on a smaller scale. If a stock has spent most of the session above VWAP and pullbacks repeatedly find buyers near the line, VWAP can show where intraday demand has been concentrated.
How Can VWAP Show Which Side Controls the Session?
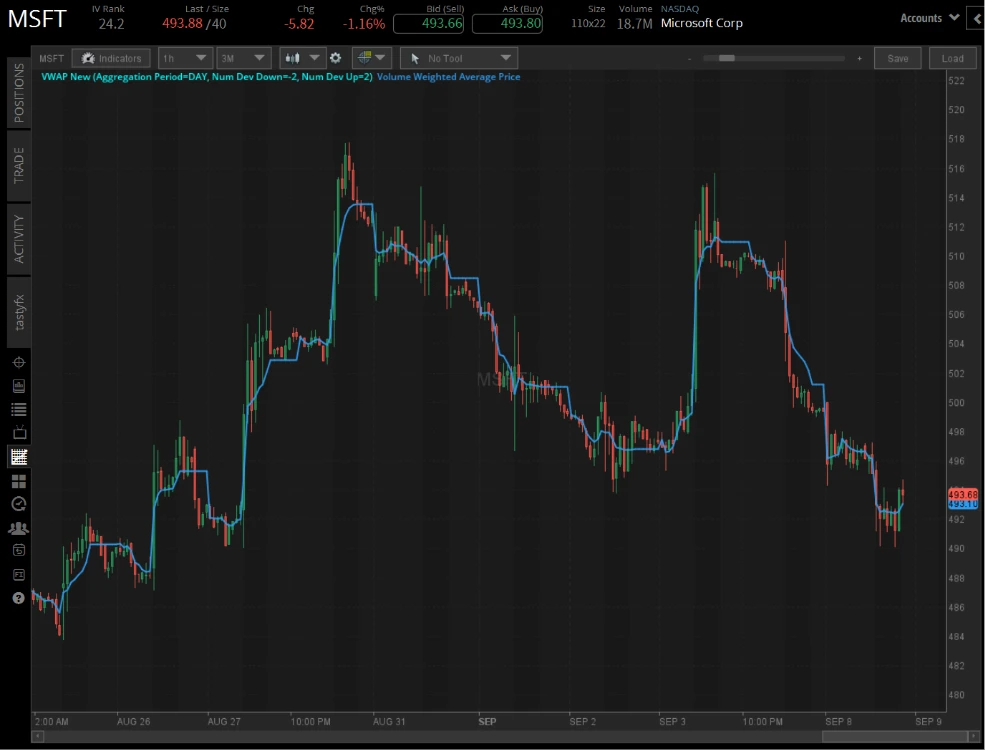
VWAP is often treated as an intraday dividing line. Price above a rising VWAP suggests buyers have control of the session and the average participant is holding a gain. Price below a falling VWAP suggests sellers have the advantage.
The slope adds information. A stock trading a few cents above a flat VWAP in a quiet range looks different from a stock holding well above a sharply rising VWAP after a high-volume breakout.
Traders can also watch the first retest after a strong move. A breakout that holds VWAP may show continued demand. A failed retest that pushes through VWAP can signal that the earlier momentum has weakened.
Can VWAP Be Used for Mean-Reversion Trading?
Some traders use VWAP for mean-reversion setups. If price stretches far above or below the session average, they look for a move back toward VWAP.
Distance alone is not enough. Strong trend days can remain extended for hours. A trader fading every move away from VWAP can accumulate losses while the market keeps trending.
Context helps separate a temporary stretch from a genuine trend. Volume, market breadth, news, opening gaps and the direction of the broader index can all influence whether VWAP is more useful as a target or as support and resistance.
How Is VWAP Different From a Moving Average?
A simple moving average calculates the average of a fixed number of price observations. A 20-period SMA drops the oldest observation each time a new bar is added.
VWAP works differently. It is cumulative from the beginning of the selected session and weights each observation by volume. A large burst of trading early in the day can continue to influence VWAP for hours.
That makes VWAP particularly useful for intraday trading. An SMA can be applied across any time frame, while standard session VWAP is tied to the day’s trading activity.
What Are the Limits of Using VWAP?
VWAP is a benchmark, not a forecast. Price can cross it repeatedly during choppy sessions, creating weak signals. The line also reacts to information that has already traded, so it cannot predict a new headline or sudden order imbalance.
Thinly traded products can produce unstable readings when a small number of prints account for a large share of daily volume. Futures, stocks and ETFs can also have different session definitions, which changes where VWAP resets.
Traders should know which session their chart uses and pair VWAP with price structure, volume and risk management. The best use is usually as context: where the market has done business, how far current price sits from that benchmark and whether buyers or sellers are defending it.
Frequently Asked Questions
Volume Weighted Average Price (VWAP) is a cumulative intraday average that weighs each price by the volume traded at that price, rather than treating every price observation equally. The standard calculation multiplies price by volume for each interval, sums those values, and divides by cumulative volume. Because prices with heavier volume carry more influence, VWAP typically differs from a simple average, and most indicators reset at the start of each new trading session.
No. VWAP reflects where trading has already occurred; it isn't a forecasting tool and cannot anticipate a new headline or sudden order imbalance. Price can cross VWAP repeatedly during choppy sessions, producing weak or conflicting signals, and thinly traded securities can produce unstable readings when a small number of prints account for a large share of volume.
A simple moving average recalculates using a fixed number of recent price observations, dropping the oldest one as each new bar forms. VWAP is cumulative from the start of the session and weights each price by volume rather than by recency, so a burst of early high-volume trading can continue influencing the calculation for hours. VWAP is generally tied to a single session, while an SMA can be applied across any timeframe.
This content, including the use of actual symbols, any visual display or other reference to product, type of investment, strategy, or service offered, is for educational and informational purposes only. It is not, nor is intended to be, trading or investment advice or a recommendation that any investment product or strategy is suitable for any person.