What is SMA (Simple Moving Average)?
 Published Aug 24, 2026
 Updated Aug 24, 2026
A simple moving average turns a series of prices into one rolling average, helping traders identify trend direction and important reference levels.
- The SMA adds a fixed number of prices and divides the total by the number of observations.
- Short SMAs react quickly, while long SMAs provide a slower view of the prevailing trend.
- Traders use SMA slope, price position and crossovers to organize entries and risk.
How a Simple Moving Average is Calculated
A simple moving average, or SMA, is the arithmetic average of price over a selected number of periods. Most charting platforms use closing prices, although the indicator can be applied to highs, lows or other data.
SMA = Sum of prices over n periods / n
Assume a stock closes at $48, $49, $50, $51, and $52 over five sessions. The five-day SMA is $50 because the sum, $250, is divided by five. On the next day, the oldest close drops out and the newest close enters the calculation. That rolling process causes the average to move over time.
Every price in the lookback period has equal weight. Yesterday’s close has the same influence as the close from five, 20 or 200 periods ago, depending on the selected setting.
Choosing the Period
Short SMAs follow price closely. Common examples include the five-day, 10-day and 20-day averages. They can help short-term traders identify momentum, but they also change direction frequently in choppy markets.
Longer SMAs move more slowly. The 50-day SMA is widely used to evaluate the intermediate trend, while the 200-day SMA is commonly used to judge the longer-term trend. These settings are conventions rather than natural laws. Their value partly comes from the number of market participants who watch them.
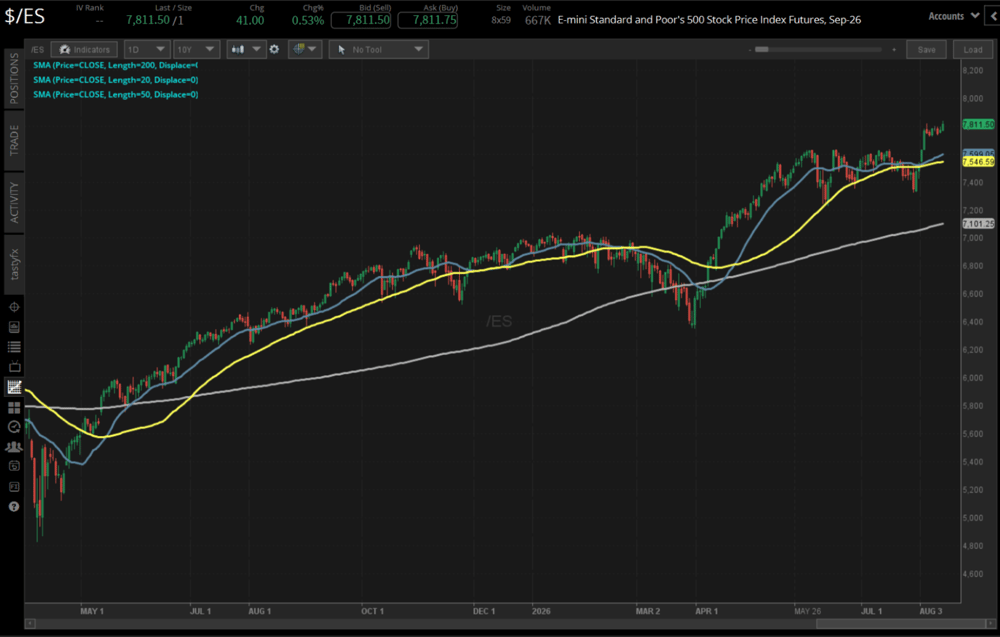
The chart time frame changes the meaning. A 20-period SMA on a five-minute chart covers 100 minutes of trading. A 20-period SMA on a daily chart covers 20 trading days worth of price data. Traders should match the period and chart interval with the holding period of the trade.
Price Position and Slope
Price above a rising SMA generally supports a bullish interpretation. Price below a falling SMA generally supports a bearish interpretation. The slope adds important information because price can cross a flat average repeatedly without establishing a trend.
A rising 50-day SMA shows that the rolling average of the past 50 closes is increasing. A falling 50-day SMA shows that the average is decreasing. A flat line suggests that gains and losses are balancing over the selected period.
Traders sometimes treat an SMA as dynamic support or resistance. In a steady uptrend, buyers may repeatedly enter near a rising average. In a downtrend, rallies may stall near a falling average. The line does not cause the reaction, but it can mark an area where market participants reassess price.
Moving Average Crossovers
A crossover occurs when a short SMA moves above or below a longer SMA. A bullish crossover shows that recent prices are improving relative to the longer-term average. A bearish crossover shows that recent prices are weakening.
The best-known examples are the golden cross and death cross. A golden cross occurs when the 50-day SMA rises above the 200-day SMA. A death cross occurs when the 50-day SMA falls below the 200-day SMA. These signals summarize a major trend change, but they arrive after a substantial part of the move has already occurred.
Faster combinations, such as the 10-day and 20-day SMAs, produce earlier signals but more false signals. Crossovers work better in sustained trends than in sideways markets, where price and the averages can cross repeatedly.
A Practical Example
Assume an index is trading at 7,800. Its 20-day SMA is 7,740 and rising, while its 50-day SMA is 7,650 and rising. Price pulls back to 7,750, holds near the 20-day average and then closes above the prior session’s high.
A swing trader could treat the rising averages as evidence that the intermediate trend remains constructive. An entry near 7,770 might use the pullback low at 7,720 as the invalidation point. The averages provide context, while the actual price low defines risk.
If the index closes below the 20-day SMA, the trader may reduce exposure rather than assume the trend has ended. A break below the 50-day SMA and a lower swing low would provide stronger evidence that the trend has changed.
The Limits of an SMA
An SMA is based entirely on past prices, so it always lags. A 200-day SMA cannot identify a turning point before price begins to move. It confirms that a trend has persisted long enough to change the average.
Large old price moves can remain in the calculation until they roll out of the lookback window. That can cause the SMA to change even when the current price is stable. Traders should remember that the line reflects both new data entering and old data leaving.
The SMA also says nothing about position size, volatility or event risk. A stock can gap far below an average after earnings. A futures contract can cross an average during a major economic release and reverse minutes later.
The indicator is valuable because it simplifies trend information. A complete trading plan still needs an entry, an invalidation level and a position size that matches the risk.
FAQ
A simple moving average equals the sum of prices over a selected number of periods divided by that number of periods, giving every price in the lookback window equal weight.
A golden cross occurs when the 50-day SMA rises above the 200-day SMA, summarizing a major bullish trend change. A death cross occurs when the 50-day SMA falls below the 200-day SMA, summarizing a major bearish trend change.
An SMA is calculated entirely from past prices, so it can only confirm a trend that has already persisted long enough to change the average. It cannot identify a turning point before price begins to move.
This content, including the use of actual symbols, any visual display or other reference to product, type of investment, strategy, or service offered, is for educational and informational purposes only. It is not, nor is intended to be, trading or investment advice or a recommendation that any investment product or strategy is suitable for any person.