How to Trade Double Bottom Patterns: A Step-by-Step Guide
 Published Aug 14, 2026
 Updated Aug 14, 2026
What Is a Double Bottom Pattern?
A double bottom pattern is a W-shaped price formation that signals a reversal from a downtrend to an uptrend. It is made up of two price lows at roughly similar price levels, separated by a moderate price peak. It's considered a bullish reversal pattern, so traders generally look for it when a security has been trending lower and appears to be losing downside momentum. Analyzing the shape of a candlestick pattern, as with all technical analysis, is an attempt to infer the psychology of the markets. It is no different with the double bottom chart pattern.
In analyzing it we might infer: the first trough reflects an initial wave of selling pressure by reaching a low point before buyers step back in. The price then is fought back to the resistance high. This forms the peak between what will be the next trough, called the neckline. Price then declines again toward the first low, but if sellers are losing conviction, the second trough tends to hold at or near the same level as the first rather than breaking meaningfully lower. A rally back through the neckline is what confirms the pattern as a possible signal. The mirror image of this setup is the double top, a bearish reversal pattern that forms after an uptrend. See our guide on candlestick patterns for other chart formations that pair with double bottoms for a broader technical analysis approach.
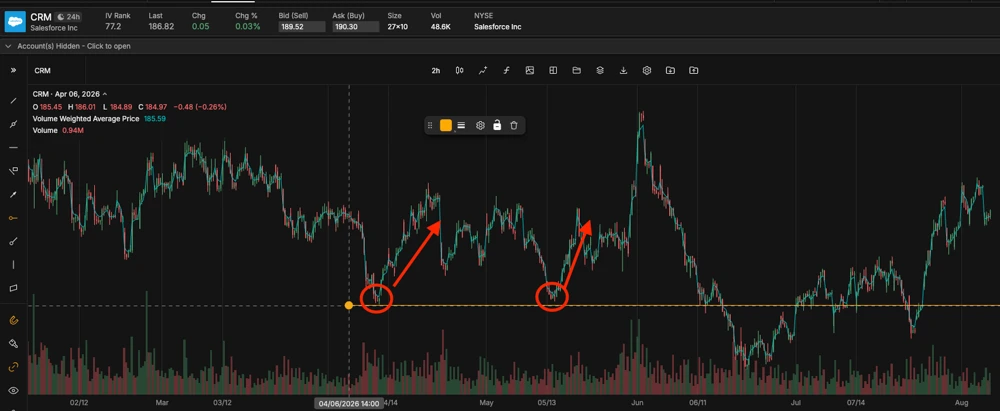
How to Identify a Double Bottom on a Chart
Not every two dips in a chart form a valid double bottom. Traders typically look for the following structural elements before treating a pattern as a legitimate signal:
- A preceding downtrend — the pattern should follow a clear decline and not appear in the middle of a sideways range.
- Two troughs at similar levels — the second low typically sits within a few percent of the first. A second trough that's meaningfully lower suggests the downtrend may still be intact.
- A defined neckline — the peak between the two troughs marks the resistance level that price needs to clear for the pattern to be considered complete.
- Adequate spacing between troughs — double bottoms that form over several weeks to months on daily or weekly charts are generally treated as more significant than versions that form over just a few sessions.
- A volume pattern that fades on the second trough — volume is often heavier on the decline into the first trough and lighter on the decline into the second, which traders read as waning selling pressure.
How to Confirm a Double Bottom Breakout
Confirmation is the step that separates a completed double bottom from two dips that happen to look similar. It typically comes down to three checks:
- Neckline breakout — price closes above the neckline, not just touches it intraday. A close above the level carries more weight than a brief wick through it.
- Volume confirmation — traders generally want to see volume on the breakout candle come in above the recent average. A breakout on light volume is treated with more caution.
- Retest — after the initial breakout, the price often pulls back to test the neckline as a new support. Holding above that level on the retest is typically viewed as a stronger confirmation than the breakout candle alone.
None of these three checks guarantee the pattern will play out, so it is another tool for traders to build a probability-based case for setting up a trade rather than a signal that price is certain to move higher.
How to Set Entry, Stop-Loss, and Price Targets
Once a breakout is confirmed, three levels typically define the trade:
Step | What to Look For | Why It Matters |
|---|---|---|
Entry | Close above the neckline, or a successful retest of the neckline as new support | Confirms buyers have taken control rather than a temporary bounce |
Stop-loss | Below the second trough, or below the retest low if one occurs | Defines maximum risk; a break below this level invalidates the pattern |
Price target | Neckline price plus the height from neckline to trough, projected up from the breakout point | A commonly used measured-move method for estimating how far a continuation might extend |
Step | What to Look For |
|---|---|
Entry | Close above the neckline, or a successful retest of the neckline as new support |
Stop-loss | Below the second trough, or below the retest low if one occurs |
Price target | Neckline price plus the height from neckline to trough, projected up from the breakout point |
Step | Why It Matters |
|---|---|
Entry | Confirms buyers have taken control rather than a temporary bounce |
Stop-loss | Defines maximum risk; a break below this level invalidates the pattern |
Price target | A commonly used measured-move method for estimating how far a continuation might extend |
Calculating a price target example:
The measured-move method projects the height of the pattern upward from the breakout point. Using a hypothetical stock, ABC, for illustration only:
- First trough: $48
- Neckline: $54
- Second trough: $48.50
- Breakout close: $55
Pattern height: $54 − $48 = $6. Projected target: $54 + $6 = $60. This is a mathematical way of estimating how far a continuation might extend based on the pattern's own dimensions, not a projection that ABC or any specific security will reach that level.
Trading a Double Bottom with Options Instead of Shares
Buying shares outright during or in anticipation of a breakout means full exposure to the stock's price ups and downs, i.e. full exposure to the downside risk of the stock. Not to mention- stocks can be expensive, at least, compared to an option. Options give traders a way to participate in the same directional exposure as a stock, but with less capital outlay. Multi-leg strategies can define further define this risk, so the potential max profits and losses are known beforehand. Options are short term vehicles, therefore if your strategy is to profit in a short time frame off a stock’s movement, options can be a convenient method to do so.
- Long calls — Less capital intensive than owning shares outright; you trade the downside risk of 100 shares for the potential loss of premium. Risks are the option expiring before any uptrends, or the uptrend not moving past your breakeven.
- Bull call spreads — buying a call at one strike and selling a call at a higher strike reduces the upfront cost and defines the risk of trade between the two strikes. In exchange for capping the maximum profit, you reduce your capital expenditure and maximum loss.
Choosing strike and expiration selection depends on your read of the candlestick pattern; strikes and expiration should match at what price and when you think the breakout is expected to play out. Amongst the many tools to decide where your option should be priced, the options Greeks can help plan your play. Delta, listed from .01 to 1.00, both tells you how much a dollar move in the underlying will increase or decrease your option’s price, and gives you a rough probability of the option being in the money by expiration. A higher Delta means a higher chance the option will be in the money by expiration but will in turn correspond to a higher premium paid. Theta, the rate at which your option loses value due to time decay, gives you a rough estimate of how much premium you’ll lose a day. Other Greeks, like Vega, can give you context to how the option will behave in a higher volatility environment, and Gamma can give you context how fast the Delta will change in response to price movements in the underlying. Like candlestick patterns and technical analysis, options Greeks aren’t guaranteed financial advice but are tools to get clarity on the potential movement of the markets. So where is the best trade? Well, the exciting part is that is up to you!
If you want to understand more about this subject before we move to charting tools, please see how to trade options.
How to Trade Double Bottom Breakouts Using tastytrade's Charting Tools
tastytrade's web platform and desktop platform include Advanced Charting, where traders can use our drawing tools to draw a double bottom breakout.
Using the chart, traders can:
- Draw horizontal lines to mark the neckline and both trough levels, visualizing the pattern.
- Apply a volume indicator below the price panel to check for the volume pattern described above.
- Pull up the option chain for the same symbol directly from the chart to compare strikes against the calculated price target.
- Switch candle time frames and adjust the period of time viewed to see if your pattern holds true on larger and smaller time scales.
tastytrade's Backtesting tool lets traders test how a specific options structure, such as a long call or bull call spread, would have performed around historical conditions. Backtested results are based on historical data and are hypothetical; they don't reflect actual trading, don't account for every factor that affects a live trade such as slippage or liquidity, and are not an indication of how a similar trade will perform in the future, but are another contextual tool for your toolkit.
Traders who want to practice spotting and trading double bottom chart patterns can open a tastytrade account to access Advanced Charting and Backtesting on both platforms. Current pricing and fees apply to any options or stock trade placed once a setup is confirmed, so please review these carefully before placing any trades.
Failed Double Bottoms and How to Manage the Risk
Double bottoms will fail to signal. Recognizing the signs early is risk management, not a flaw in the pattern itself:
- False breakout — price closes above the neckline, then reverses back below it within a few sessions. This is one reason some traders wait for a retest before entering rather than acting on the first close above the neckline.
- Breakout without volume — a move above the neckline on below-average volume is more prone to failing than one backed by a volume increase.
- A break below the second trough — this generally invalidates the pattern altogether and suggests the original downtrend may be resuming rather than reversing.
Chart patterns are never a guarantee, so context matters more than any single confirmation signal, and practicing risk management will protect your position if it is a failed indicator. tastytrade offers many tools to hedge the risk of a failed indicator, like using a predefined stop-loss below the second trough to help limit the downside on a stock position if the breakout isn’t a reversal. Concerning a long call or bull call spread, the maximum loss is already defined by the premium paid or the net cost of the spread, so this is one reason some traders prefer a defined-risk options structure over holding shares through an unconfirmed breakout. Yet options come with other risks – if you paid too high a premium for a long call the breakout could be a loss if it doesn’t increase the options value above what you paid for it. A bull call spread’s short option could be assigned leaving you with a long option and a short 100 shares. Whether you use shares, a long call, or a bull call spread, all potential trades come with unique benefits and risks, and the good trader knows when to take advantage of these benefits and when to practice proper risk management.
FAQs
A double bottom pattern is bullish. It forms after a downtrend and is read as a potential reversal signal to an uptrend, meaning traders watch it as an indication that a decline may be ending, not continuing.
A double bottom is a W-shaped bullish reversal pattern that forms after a downtrend, with two troughs separated by a neckline. A double top is its bearish mirror image: an M-shaped pattern that forms after an uptrend, with two peaks separated by a neckline, and is read as a potential signal that an advance may be ending.
The most commonly used method measures the height of the pattern, the distance from the neckline down to the trough level, and projects that same distance upward from the breakout point. For example, a $6 pattern height added to a $54 neckline signals a target price of $60. This is a measurement technique based on the pattern's own dimensions, not a guarantee that price will reach that level.
Common causes include a breakout that isn't backed by increased volume, a false breakout where price closes back below the neckline shortly after breaking above it, or a decline that breaks below the second trough entirely, which invalidates the pattern and suggests the prior downtrend may be resuming.
This content is for educational purposes only. It is not, and is not intended to be, trading or investment advice or a recommendation that any security, strategy, or account type is suitable for any particular person. Chart patterns, including double bottoms, are based on historical price action and do not predict or guarantee future results. The hypothetical example in this article, including the ticker "ABC," is for illustrative purposes only and does not represent any actual security or trade.
Options involve risk and are not suitable for all investors. Prior to trading options, review the Characteristics and Risks of Standardized Options disclosure document.
Backtested or hypothetical performance results have inherent limitations, are not indicative of actual trading, and are not an indication of how a trade or strategy will perform in the future. No representation is made that any account will or is likely to achieve results similar to those shown by a backtest.