The Ultimate List of Candlestick Patterns (2026 Guide)
 Published Aug 14, 2026
 Updated Aug 14, 2026
What Are Candlestick Patterns?
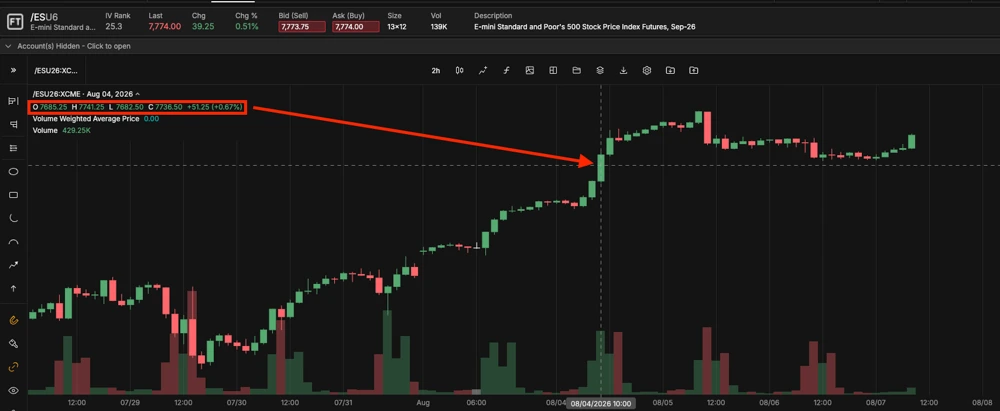
Candlestick patterns are chart patterns, but more specifically, visual formations of charted price movements which can signal potential market movement and trends in an asset or index. Each individual candle shows the open, high, low, and close for a given time period, and the shape, color, and position of candles relative to one another are where patterns form that traders can use to gauge shifts in buying and selling pressures.
Candlestick patterns date back to 18th-century Japanese rice trading and were popularized in Western markets in the 1990s. Today they're a standard part of technical analysis. They’re not used as a standalone signal, but alongside indicators, volume, and general trends to give the trader context for what could happen next.
A candlestick pattern reflects a signal of potential market activity in the future. It does not predict what will happen next. Traders use these visual formations to build a probability-based view of near-term price action.
How to Read a Candlestick Chart
Every candle is built from four data points for a chosen time frame (1-minute, daily, weekly, and so on):
Open — the first traded price in the period.
High — the highest traded price in the period.
Low — the lowest traded price in the period.
Close — the last traded price in the period.
The rectangular section of the body represents the range between open and close. A green or unfilled body means the close was higher than the open, i.e. a bullish candle; a red or filled body means the close was lower than the open, i.e. a bearish candle. The “wicks” or lines above and below the body mark the high and low. Body size reflects market pressure. A long body indicates strong buying or selling pressure to their respective directionalities (bullish/green or bearish/red), while shorter bodies indicate market consolidation (evenly matched buyers and sellers). The smaller the body, the less price range, momentum, and directionality. No candle body (Doji) indicates market indecision and a potential turning point.
Bullish Candlestick Patterns
These formations have historically appeared near the end of a downtrend or during an uptrend, and traders commonly read them as a signal that buying pressure may be building which could signal a potential uptrend. As with every pattern in this guide, no patterns guarantee a specific market move, and every pattern is best understood in context to its greater market.
Single-candle bullish patterns
Hammer — will appear at the bottom of a downtrend; it is a small body near the top of the candle’s range with a long lower wick and little to no top wick. The long lower wick is sellers trying to drive the price down, but then buyers were able to rally it back to its high. Shows selling pressure could be weakening.
Inverted Hammer — will appear at the bottom of a downtrend and is a small body near the bottom of the candle’s range with a long top wick and little to no lower wick. The long top wick indicates buyers pushed well above the open, but that sellers brought it down towards the close. Indicates selling pressure could be exhausted.
Bullish Marubozu — a full-bodied green candle with no wicks. Buyers controlled the entire period from open to close.
Double-candle bullish patterns
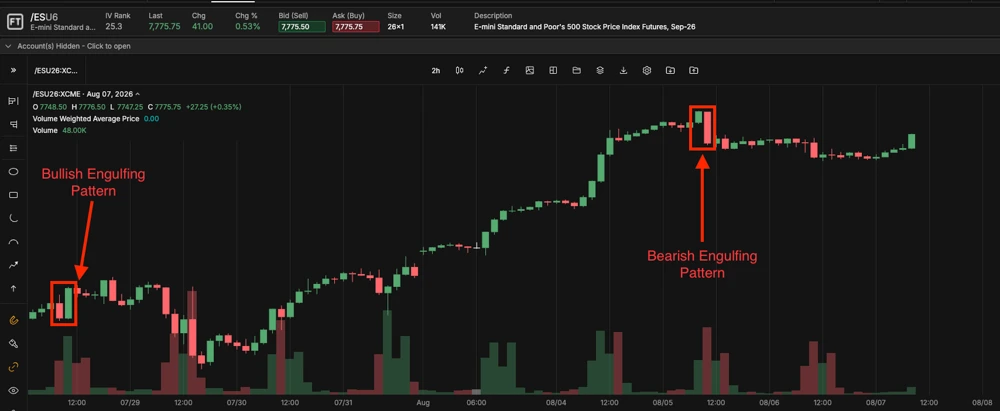
Bullish Engulfing — a bearish candle followed by a larger bullish candle whose body fully covers the prior body. The shift in size signals a swing in control from sellers to buyers.
Piercing Line — a bearish candle followed by a bullish candle that opens below the prior close but closes above the prior candle's midpoint.
Tweezer Bottom — two consecutive candles that touch nearly the same low after a downtrend, suggesting sellers failed to push the price to a new low a second time.
Triple-candle bullish patterns
Morning Star — a bearish candle, a small-bodied candle showing indecision, then a bullish up candle. The three-candle sequence shows selling pressure fading before buyers take over.
Three White Soldiers — three consecutive bullish candles, each closing higher than the last with limited upper wicks, showing sustained buying pressure, if appearing after a downtrend could signal a reversal, but appearing during an uptrend it could signal a continuation.
Three Inside Up — a bearish candle, a smaller candle contained within its range, then a bullish candle that closes above the first candle's open. The bearish candle, to smaller candle, to bullish candle could suggest buyers are taking control and the price will be increasing.
Bearish Candlestick Patterns
These formations have historically appeared near the end of an uptrend or during a downtrend, and traders commonly read them as a signal that selling pressure may be building.
Single-candle bearish patterns
Hanging Man — the same shape as a hammer (small body, long lower wick) but appearing after an uptrend instead of a downtrend. Hints buying pressure could be weakening because sellers could gain so much ground in a market rally.
Shooting Star — Appearing at the top of an uptrend, it is a small body near the bottom of the price range with a long upper wick. Buyers pushed the price higher during the period before sellers took it back down.
Bearish Marubozu — a full-bodied red candle with no wicks. Sellers controlled the entire period from open to close.
Double-candle bearish patterns
Bearish Engulfing — a bullish candle followed by a bearish candle whose body fully covers the prior body. Suggests buying pressure are being overwhelmed by selling pressures, and momentum has flipped to a downtrend.
Dark Cloud Cover — a bullish candle followed by a bearish candle that opens above the prior close but closes below the bullish candle's midpoint. The failure to hold a high and penetrate deep into the bullish candle suggests buying pressure is faltering.
Tweezer Top — Forming at the end of an uptrend, it is two consecutive candles that touch nearly the same high after an advance. A repeated failure to break through a high suggests buying pressure is exhausted, and selling pressure may reassert control to create a downtrend.
Triple-candle bearish patterns
Evening Star — it is a bullish candle, followed by a small-bodied candle showing indecision, and then a bearish candle. Appearing at the top of an uptrend, this suggests buying momentum is shifting to a downtrend as the gains on the bullish candle stall with second candle and then are eliminated by the bearish candle.
Three Black Crows — three consecutive bearish candles, each closing lower than the last with limited lower wicks. After an uptrend this could read as a reversal, but within an existing downtrend it could read as a continuation – either way a bearish signal.
Three Inside Down — it is a bullish candle with a smaller candle contained within its range, and then a bearish candle that closes below the first bullish candle's open. The bullish candle’s gains being eliminated suggests control is moving towards the sellers signaling a potential downtrend.
Reversal vs. Continuation Candlestick Patterns
Every pattern in this guide falls into one of two categories based on what it signals about future trends. Some patterns are context dependent, and can mean either in differing contexts:
Reversal patterns — form after a trend has been in place and suggest that trend may be losing momentum.
Continuation patterns — form during a trend and suggest a brief pause before the existing trend resumes.
The same basic shapes can carry different implications depending on where they appear on the chart. A pattern's location relative to the broader trend, not just its shape, is what informs whether it is a signal or noise. Every candlestick pattern should be taken in context within broader market trends.
Candlestick Patterns Cheat Sheet
The table below summarizes every pattern covered in this guide.
Pattern | Candles | Signal | Type | Historical Tendency |
|---|---|---|---|---|
Doji | 1 | Neutral | Indecision | Marks hesitation; direction depends on what follows |
Hammer | 1 | Bullish | Reversal | Seen after declines; long lower wick, small body |
Inverted Hammer | 1 | Bullish | Reversal | Seen after declines; long upper wick, small body |
Hanging Man | 1 | Bearish | Reversal | Seen after advances; same shape as hammer |
Shooting Star | 1 | Bearish | Reversal | Seen after advances; long upper wick, small body |
Spinning Top | 1 | Neutral | Indecision | Small body, wicks on both sides |
Marubozu | 1 | Both | Continuation or reversal | No wicks; full-bodied candle showing conviction |
Bullish Engulfing | 2 | Bullish | Reversal | Second candle fully covers the prior red body |
Bearish Engulfing | 2 | Bearish | Reversal | Second candle fully covers the prior green body |
Piercing Line | 2 | Bullish | Reversal | Second candle closes above the midpoint of the first |
Dark Cloud Cover | 2 | Bearish | Reversal | Second candle closes below the midpoint of the first |
Tweezer Bottom | 2 | Bullish | Reversal | Matching lows on consecutive candles after a decline |
Tweezer Top | 2 | Bearish | Reversal | Matching highs on consecutive candles after an advance |
Morning Star | 3 | Bullish | Reversal | Down candle, small-bodied candle, up candle |
Evening Star | 3 | Bearish | Reversal | Up candle, small-bodied candle, down candle |
Three White Soldiers | 3 | Bullish | Continuation or reversal | Three consecutive up candles with higher closes |
Three Black Crows | 3 | Bearish | Continuation or reversal | Three consecutive down candles with lower closes |
Three Inside Up | 3 | Bullish | Reversal | Down candle, inside candle, confirming up candle |
Three Inside Down | 3 | Bearish | Reversal | Up candle, inside candle, confirming down candle |
Rising Three Methods | 5 | Bullish | Continuation | Long up candle, small pullback candles, long up candle |
Falling Three Methods | 5 | Bearish | Continuation | Long down candle, small bounce candles, long down candle |
Pattern | Candles |
|---|---|
Doji | 1 |
Hammer | 1 |
Inverted Hammer | 1 |
Hanging Man | 1 |
Shooting Star | 1 |
Spinning Top | 1 |
Marubozu | 1 |
Bullish Engulfing | 2 |
Bearish Engulfing | 2 |
Piercing Line | 2 |
Dark Cloud Cover | 2 |
Tweezer Bottom | 2 |
Tweezer Top | 2 |
Morning Star | 3 |
Evening Star | 3 |
Three White Soldiers | 3 |
Three Black Crows | 3 |
Three Inside Up | 3 |
Three Inside Down | 3 |
Rising Three Methods | 5 |
Falling Three Methods | 5 |
Pattern | Signal |
|---|---|
Doji | Neutral |
Hammer | Bullish |
Inverted Hammer | Bullish |
Hanging Man | Bearish |
Shooting Star | Bearish |
Spinning Top | Neutral |
Marubozu | Both |
Bullish Engulfing | Bullish |
Bearish Engulfing | Bearish |
Piercing Line | Bullish |
Dark Cloud Cover | Bearish |
Tweezer Bottom | Bullish |
Tweezer Top | Bearish |
Morning Star | Bullish |
Evening Star | Bearish |
Three White Soldiers | Bullish |
Three Black Crows | Bearish |
Three Inside Up | Bullish |
Three Inside Down | Bearish |
Rising Three Methods | Bullish |
Falling Three Methods | Bearish |
Pattern | Type |
|---|---|
Doji | Indecision |
Hammer | Reversal |
Inverted Hammer | Reversal |
Hanging Man | Reversal |
Shooting Star | Reversal |
Spinning Top | Indecision |
Marubozu | Continuation or reversal |
Bullish Engulfing | Reversal |
Bearish Engulfing | Reversal |
Piercing Line | Reversal |
Dark Cloud Cover | Reversal |
Tweezer Bottom | Reversal |
Tweezer Top | Reversal |
Morning Star | Reversal |
Evening Star | Reversal |
Three White Soldiers | Continuation or reversal |
Three Black Crows | Continuation or reversal |
Three Inside Up | Reversal |
Three Inside Down | Reversal |
Rising Three Methods | Continuation |
Falling Three Methods | Continuation |
Pattern | Historical Tendency |
|---|---|
Doji | Marks hesitation; direction depends on what follows |
Hammer | Seen after declines; long lower wick, small body |
Inverted Hammer | Seen after declines; long upper wick, small body |
Hanging Man | Seen after advances; same shape as hammer |
Shooting Star | Seen after advances; long upper wick, small body |
Spinning Top | Small body, wicks on both sides |
Marubozu | No wicks; full-bodied candle showing conviction |
Bullish Engulfing | Second candle fully covers the prior red body |
Bearish Engulfing | Second candle fully covers the prior green body |
Piercing Line | Second candle closes above the midpoint of the first |
Dark Cloud Cover | Second candle closes below the midpoint of the first |
Tweezer Bottom | Matching lows on consecutive candles after a decline |
Tweezer Top | Matching highs on consecutive candles after an advance |
Morning Star | Down candle, small-bodied candle, up candle |
Evening Star | Up candle, small-bodied candle, down candle |
Three White Soldiers | Three consecutive up candles with higher closes |
Three Black Crows | Three consecutive down candles with lower closes |
Three Inside Up | Down candle, inside candle, confirming up candle |
Three Inside Down | Up candle, inside candle, confirming down candle |
Rising Three Methods | Long up candle, small pullback candles, long up candle |
Falling Three Methods | Long down candle, small bounce candles, long down candle |
How to Spot These Patterns Faster With tastytrade's Charting Tools
Reading candlestick patterns manually across multiple symbols and time frames takes practice. tastytrade's web platform and desktop platform both include advanced charting and drawing tools, a full library of technical indicators, and the ability to view the same symbol across multiple time frames side by side.
On the chart, traders can:
- Switch between candlestick, bar, and line chart types on any time frame
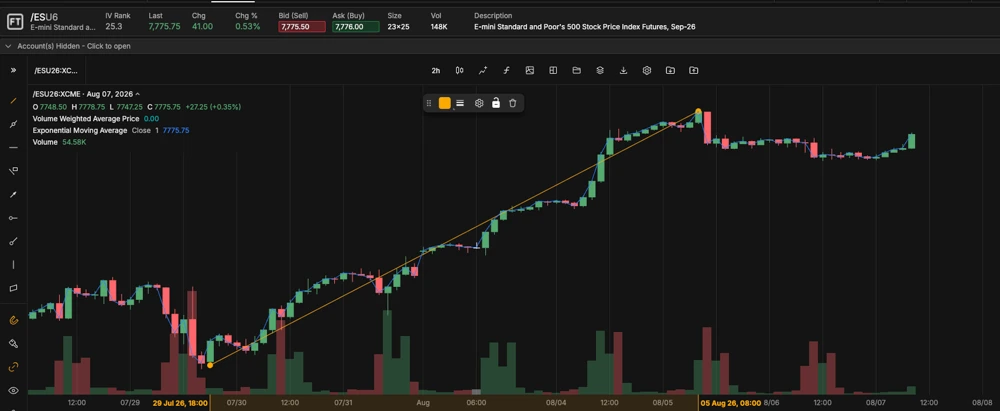
- Apply drawing tools to mark support, resistance, and trendlines around a pattern
- Layer indicators such as moving averages or volume alongside a pattern for confirmation, rather than trading the candle in isolation
- Open multiple time frame windows for the same symbol to see whether a pattern on a daily chart aligns with the intraday trend
Before acting on a pattern, pull up the symbol's option chain or futures contract directly from the chart to review current pricing. If placing a trade, please review commissions & fees before submitting the order. Chart tools help identify a pattern faster; they do not remove the underlying risk of the position.
Traders who want to explore candlestick patterns on live markets can open a tastytrade account to access advanced charting on both the web and desktop platforms.
Common Mistakes When Trading Candlestick Patterns
Trading a pattern in isolation — a single candle rarely tells the full story, so context is key. Traders typically weigh a pattern against the broader trend, volume, and nearby support or resistance.
Ignoring confirmation — many reversal patterns are treated as more significant when the next candle confirms the move, rather than acting on the pattern candle alone.
Over-emphasizing rare patterns — some multi-candle formations appear infrequently on any given chart. Waiting for a specific pattern can mean missing more common patterns.
Skipping the broader time frame — a pattern on a 5-minute chart can conflict with the daily trend. Checking multiple time frames helps put a single pattern in context.
Treating a pattern as a trade plan — a candlestick pattern can inform an entry idea, but position size, defined risk, and an exit plan are separate decisions a pattern does not make for you.
For a deeper look at applying technical tools like moving averages alongside chart patterns, see how EMAs work on tastytrade's charts.
FAQs
No candlestick pattern is guaranteed to predict future price movement, so there is no single most reliable pattern. Multi-candle patterns like bullish and bearish engulfing or morning and evening star are often discussed as carrying more weight than single-candle patterns because they require two or three candles of confirming price action rather than one.
Traders commonly reference a core list of 20 to 40 named candlestick patterns, though the exact count varies by source depending on how single-, double-, and triple-candle variations are grouped. This guide covers the most frequently referenced bullish and bearish patterns across all three categories.
No. Candlestick patterns describe price action that has already happened and reflect a shift in buying or selling pressure during that period. They do not predict future price movement, and past patterns are not an indication that a similar pattern will produce the same result in the future.
A doji is a single candle where the open and close are at or very near the same price, leaving little to no body and wicks on one or both sides. It reflects indecision between buyers and sellers during that period. A doji's significance typically depends on where it appears, such as an extended trend, rather than on the doji alone.
This content is for educational purposes only. It is not, and is not intended to be, trading or investment advice or a recommendation that any security, strategy, or account type is suitable for any particular person. Chart patterns, including candlestick patterns, are based on historical price data and do not predict or guarantee future results.
Options involve risk and are not suitable for all investors. Prior to trading options, review the Characteristics and Risks of Standardized Options disclosure document.
Futures and futures options trading is speculative and is not suitable for all investors. Futures accounts are not protected by the Securities Investor Protection Corporation (SIPC). Prior to trading futures, review the Futures & Exchange-Traded Options Risk Disclosure Statement.