What is the Descending Triangle Chart Pattern?
 Published Oct 7, 2026
 Updated Oct 7, 2026
A descending triangle forms when price makes lower highs against a relatively flat support level, creating a compression pattern that often precedes a bearish breakdown
- The pattern combines a falling resistance line with a horizontal or nearly horizontal support level.
- Repeated tests of support can show sellers becoming more aggressive as each rebound reaches a lower high.
- Traders often wait for a confirmed break below support, then use the triangle's height to estimate a potential downside objective.
How Does a Descending Triangle Actually Form?
A descending triangle is a chart pattern that forms as a downward-sloping resistance line converges with a flat support line. Each rally creates a lower high while buyers keep defending the same support level below.
As the lines converge, the range gets smaller. Sellers accept lower prices on each rebound while buyers absorb supply near the floor.
The pattern usually needs multiple touches. A trader may draw the falling resistance line through two or more lower highs and the support line through repeated lows near the same price. The important feature is declining highs above a clear support zone.
Why Is a Descending Triangle Considered Bearish?
The descending triangle is usually viewed as bearish because the balance of pressure is changing inside the range. Buyers defend the floor, but every bounce loses strength. Sellers step in at progressively lower prices.
Repeated support tests can consume available demand. Each test gives sellers another opportunity to trade against the same buyers.
The signal comes from the breakdown. Until price trades through support, the pattern remains a compression. A confirmed break shows the buyers defending the floor could not absorb the next wave of selling.
What Does a Descending Triangle Look Like in Practice?
Assume ABC trades down from $55 and finds support near $48. The first rebound reaches $53, the next reaches $51.50 and the third stalls near $50.50. Each rally high is lower, while several pullbacks stop between $47.90 and $48.10.
Those swings create a descending resistance line above a support zone near $48.
ABC then closes at $47.40 on heavier volume. A trader may treat the close below support as confirmation. The old $48 floor can become a resistance reference if price rebounds after the breakdown.
The pattern now gives the trader a defined bearish setup: the breakdown near $48, a potential invalidation above reclaimed support and a structure for estimating a downside target.
How Do You Measure a Price Target From a Descending Triangle?
A common target method measures the vertical height of the triangle at its widest point and subtracts that distance from the breakdown level.
Suppose the first major lower high sits near $289 while support is $263. The triangle is about $26 high. A break below triangle support creates a measured objective from the breakout point minus the $26 difference.
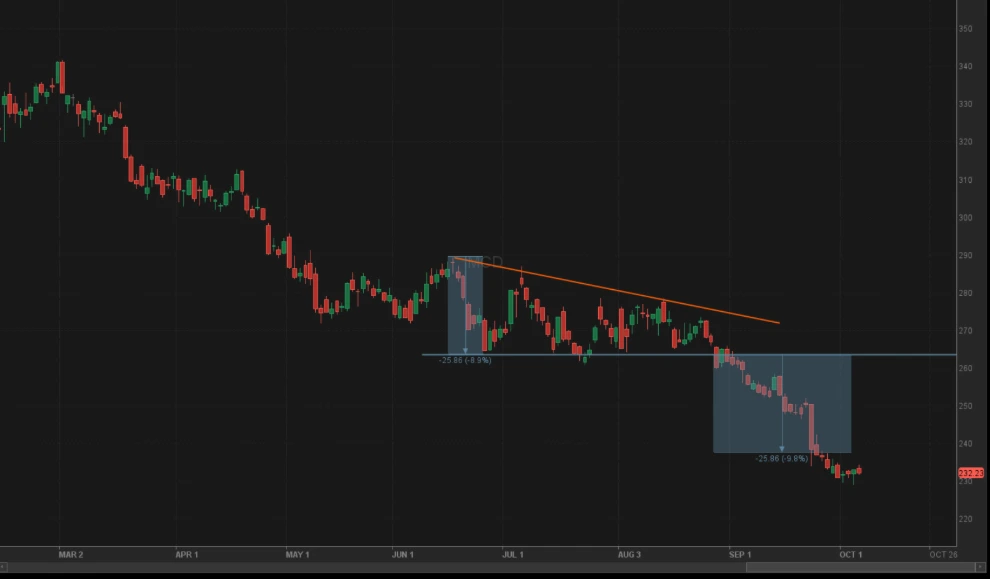
McDonalds (MCD) provides a practical example. In June 2026, a descending triangle formed with a $26 height. Breaking out from near $264 in August 2026, the measured move targeted near $238. MCD felt to a low of $234.03 by September 23.
That projection is a reference, not a promise. Prior lows, round numbers, earnings events and broader market conditions can change the path. Some traders take partial profits before the full target and manage the rest using trailing stops or new swing highs.
A clean support zone and a well-defined series of lower highs provide a more useful measurement than a loose collection of swings.
How Does Volume Confirm a Descending Triangle Breakdown?
Volume confirms a breakdown when a decline below the support floor happens on rising participation, suggesting more sellers are actively acting on the break rather than price simply drifting through a thin market.
Some descending triangles show contracting volume while the range narrows, followed by expansion when support gives way—a sequence that fits the idea of pressure building inside the pattern before the market chooses a direction.
A breakdown on light volume can still continue, especially in products where volume is less informative. Traders can also watch how price behaves after the break. A failed rebound into former support can confirm that the old floor has turned into resistance.
How Do Traders Approach Entry and Risk Management?
The aggressive entry is the first break below support. A more conservative trader may wait for a close below the level or for a rebound that fails beneath the former floor.
Stops can be placed above the breakdown area, above the most recent lower high or above the descending trendline. Each choice changes the tradeoff between stop distance and position size.
Assume the short entry is $47.50 and the stop is $49.00. The risk is $1.50 per share. A trader risking $300 on the position could size the trade at roughly 200 shares before accounting for slippage, margin requirements, and fees.
The calculation turns the chart pattern into a defined trade rather than a directional guess.
When Does a Descending Triangle Fail?
The bearish setup fails when price reclaims support and begins breaking the sequence of lower highs. An upside break through the descending trendline can trap traders who entered early and create a sharp rally as short positions are covered.
Traders generally wait for the market to leave the triangle before assuming the pattern has completed. The pattern can also appear during an uptrend, where the triangle may resolve higher instead.
How Is a Descending Triangle Different From a Falling Wedge?
A descending triangle has a flat, horizontal support level, while a falling wedge has a lower trendline that also slopes downward, creating two converging lines. That's the key structural difference between the two patterns. The two can look similar at a glance because both contain a downward-sloping upper trendline, but the lower boundary is what separates them.
That difference changes the usual interpretation. The descending triangle carries a bearish bias because sellers keep pressing against a fixed floor. The falling wedge usually carries a bullish bias because both highs and lows are declining while the downside range contracts.
For traders, the value of the descending triangle comes from the same discipline used with any chart pattern: define the boundaries, wait for confirmation, size the position from the invalidation point and judge the breakout by what price does next.
Frequently Asked Questions
A descending triangle is generally viewed as bearish because buyers keep defending a flat support level while each rally reaches a lower high, meaning sellers are willing to sell at progressively lower prices. The actual signal comes from the breakdown itself — until price trades through support, the pattern remains a compression rather than a confirmed bearish move. A descending triangle can also appear during an uptrend and resolve to the upside instead.
A common method measures the vertical height of the triangle at its widest point, then subtracts that distance from the breakdown level to estimate a downside objective. This measured-move projection is a reference point, not a guarantee — prior support levels, round numbers, earnings events, and broader market conditions can all change the actual path price takes after a breakdown.
Both patterns feature a downward-sloping upper trendline, but the lower boundary is what separates them. A descending triangle has a flat, horizontal support level, while a falling wedge has a lower trendline that also slopes downward, creating two converging lines. This structural difference changes the typical interpretation — descending triangles usually carry a bearish bias, while falling wedges usually carry a bullish bias.
This content, including the use of actual symbols, any visual display or other reference to product, type of investment, strategy, or service offered, is for educational and informational purposes only. It is not, nor is intended to be, trading or investment advice or a recommendation that any investment product or strategy is suitable for any person.