The Fundamentals of Trend Trading
There are three general market types that traders should learn to navigate: trend, breakout, and range. While you’ll likely gravitate towards one style over the others, it’s important to be flexible and adapt to each type, since markets naturally cycle through volatility regimes.
A breakout strategy focuses on selling once support is lost or buying once resistance is breached. Range trading rests on the belief that “traders should sell high and buy low” as prices will stay flat over a period. In other words, “the range will hold.”
In this guide, we will discuss the ins and outs of trending markets—why trends form, pros & cons of trading trends, how to identify good trends, and various tactics for taking advantage of trends.
Why Do Trends Form?
Technical analysis is often a misunderstood discipline and even misrepresented by some of its biggest proponents. Technical analysis doesn’t necessarily drive the market, but it can influence trading behavior. More than anything, it represents how market participants collectively interpret underlying fundamentals, catalysts, and emerging themes.
In a choppy, range-bound market, there is an equilibrium between buyers and sellers in the absence of an underlying driver. In a breakout market, there is a gear switch towards a theme. In a trending market, the theme strengthens and becomes sustainable. A strong trend isn’t easily disrupted by individual events or data releases. These usually cause only brief setbacks before traders refocus on the broader underlying theme.
In the beginning of a trend, the theme isn’t visible to many. As it matures, it becomes apparent to an increasingly less sophisticated crowd of traders until the trend eventually reaches a point of exhaustion and changes course.
Pros and Cons of Trading Trends
One of the biggest advantages of trading trends can be the potential reward. Strong trends are known for lasting much longer than most people estimate, which is exactly why they can go well beyond ‘reasonable’ expectation. Risk/reward ratios for trend-following strategies are typically higher than, say, range strategies, but they also come with a lower win/loss percentage. This is fine as long as the rewards are worth the lower probabilities of success on a per-trade basis.
One of the drawbacks to trend-trading is that good trends aren’t frequent. Oftentimes, markets spend time chopping around in search of a direction. This can make for a lot of starting and stopping before a tailwind can push a market for a sustained period. This is why it is a good idea to also have strategies for those markets that are caught in a range prior to a breakout.
Trends Develop on All Time Frames
Trends develop in all time frames. As a result, what is an uptrend on a short-term timeframe can be nothing more than a counter-trend on a longer-term time frame.
A trader’s focus should be on the time frame that most closely matches their objectives. For example, a short-term swing trader with intentions of holding positions for several days to weeks will focus primarily on the daily and 4-hour charts. By contrast, day traders will mostly focus on intra-day time frames.
A good rule of thumb is that the higher time frame takes precedence (i.e., weekly > daily, daily > 4-hour). Due to the effectiveness and popularity of the short-term swing trade, in this guide, we will focus on the daily and 4-hour timeframes.
How To Identify a Trend
Aside from making a general observation by looking at a chart, there are quantifiable ways to determine and measure trends. Methods range from price action to moving averages to using more sophisticated indicators derived from mathematical formulas. Two of the simplest and most robust ways to identify a trend involve observing basic price action and moving averages.
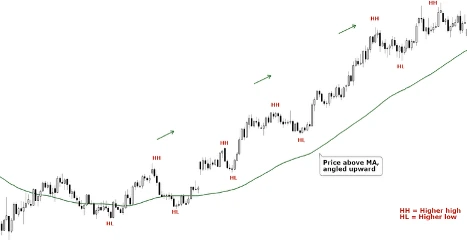
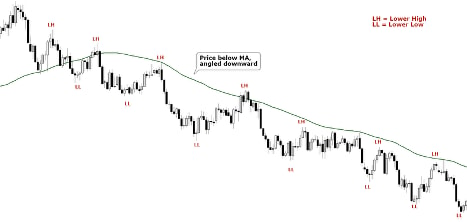
When looking at price action, an uptrend is marked by a series of higher highs and higher lows, while a downtrend consists of lower lows and lower highs.
Another straightforward way to identify the trend is by using moving averages (MA). The simplest approach is to use one moving average (it can be SMA or EMA, just be consistent in what you use) and how price relates to it (price > MA = uptrend; price < MA = downtrend). Another method is by looking at the tilt of the angle of the moving average (angled upward = uptrend; angled downward = downtrend).
Uptrend | Higher highs, higher lows | Above Moving Average (EUR/USD)
Downtrend | Lower highs, lower lows | Below Moving Average (AUD/USD)
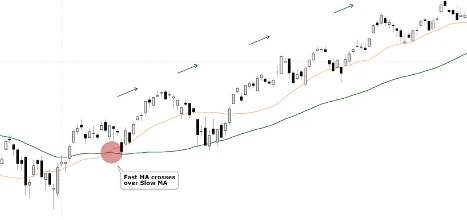
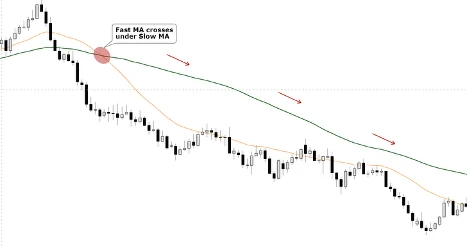
You can also use more than one moving average and look at how the moving averages (MA) relate to one another. If using two MAs, when the shorter is above the longer the market is trending higher. Conversely, if the shorter MA is below the longer MA, then the market is considered to be in a downtrend. For example, if the 50-day MA > 200-day MA, the trend is considered up, and if the 50-day MA is below the 200-day MA, then the trend is down.
It’s worth noting that when a moving average trend signal exists, you generally have the corresponding price action of higher highs/higher lows (up) or lower lows/lower highs (down).
Uptrend with Two Moving Averages (S&P 500)
Downtrend with Two Moving Averages (GBP/USD)
There are also a host of mathematically derived indicators to measure trends and their strength. Average Directional Index (ADX) and Moving Average Convergence Divergence (MACD) are popular choices you may want to explore.
Trading Strategies for Trends
There are several ways to enter a trend, but two of the most common methods are via pullbacks and continuation patterns.
Pullback Trading
Pullback trading is when you enter the market on a counter-trend price swing, or correction. Markets rarely go straight up or down, which means they undergo corrective periods where price moves counter to the prevailing trend and works off overbought (in an uptrend) or oversold (in a downtrend) conditions that may have built up during the most recent leg of the trend.
Using support and resistance can be a highly effective way to determine when a pullback has run its course and the price is ready to resume in the direction of the prevailing trend. Price levels, trend-lines, moving averages, and Fibonacci retracements are the most popular forms of support and resistance, but other disciplines can be used as well.
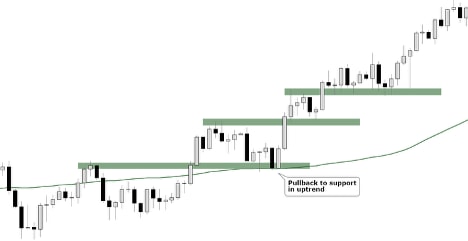
Confluence between two or more types of support/resistance helps strengthen the case for a particular price level or zone acting as the most optimal level to watch for buyers or sellers to come in. For example, if Brent Crude Oil (see below) is trending higher and it pulls back into price support that is in confluence with a moving average, it is considered a stronger level than if it were just one of the two technical events on its own.
Pullback to Support Offers Entry for Longs (Brent Crude Oil)
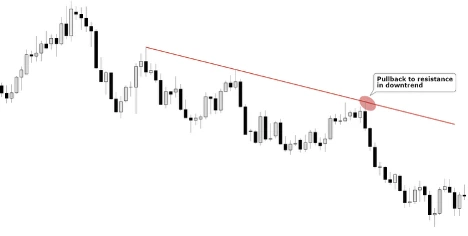
Pullback to Trend-line Resistance Offers Entry for Shorts (AUD/USD)
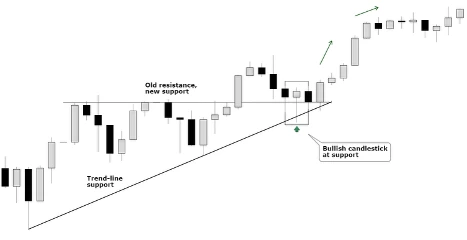
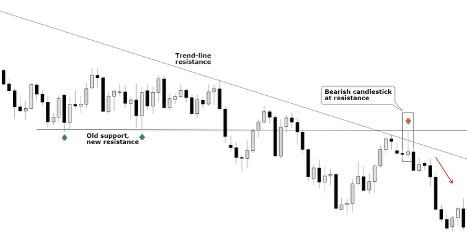
Traders can enter into a position upon price touching a level or wait for a price action event to develop that creates a swing-low (for longs) or swing-high (for shorts). Candlesticks can be highly effective for doing just this. There are a host of candlestick configurations, but looking at some of the simpler variations is enough. Bullish hammers and bearish shooting stars are great for seeing the rejection at support or resistance, respectively.
Bullish Candlestick at Confluent Support for Long Entry (DAX 30)
Bearish Candlestick at Confluent Resistance for Short Entry (AUD/USD)
Continuation Patterns
Continuation patterns are another way to jump aboard a trend. These formations are a pause in price action that indicates an increased likelihood that the trend will resume once the digestion period has concluded. A few of the most popular patterns are triangles/wedges, rectangles, and bear/bull-flags.
Triangle/Wedge
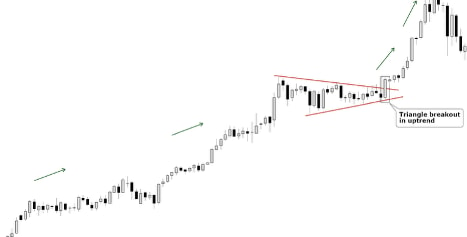
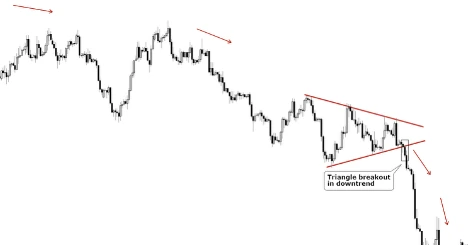
A triangle/wedge is exactly as it sounds and is simply a congestion pattern formed as volatility shrinks the price towards the apex of the formation. These can take on a variety of shapes: symmetrical, ascending, and descending. The symmetrical variation is simply two converging lines representing a pending breakout. An ascending wedge has a flat top with higher lows. A descending wedge has a flat bottom with lower highs. The key to trading these patterns is waiting for a confirmed breakout above the top or bottom trendline of the formation to avoid false signals.
Triangle Breakout in Uptrend (US Dollar Index)
Triangle Breakout in Downtrend (GBP/USD)
Rectangles
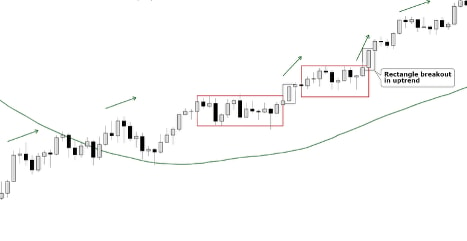
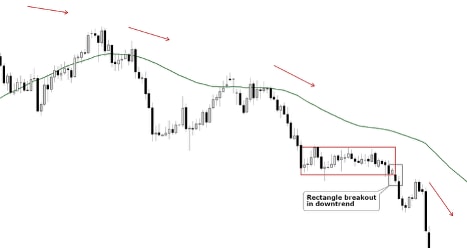
Rectangles are sideways patterns that show very limited ability to reverse the trend. This horizontal price action acts as a pause, and once the price breaks free from it, traders can take advantage of the next leg higher or lower.
Bullish Rectangle in Uptrend (WTI Crude Oil)
Bearish Rectangle in Downtrend (Silver)
Bull- and Bear-Flags
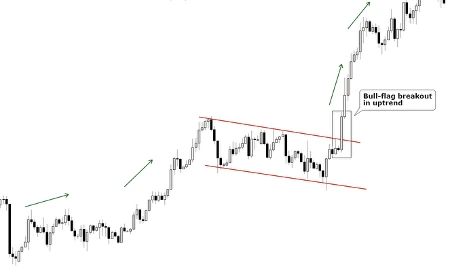
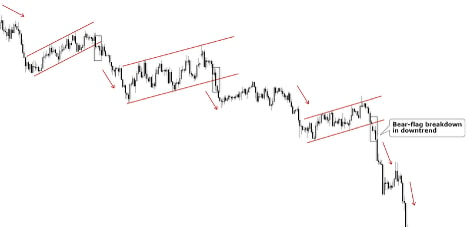
Bull- and bear-flags develop as a retracement fails to garner much power, marked by overlapping price action running counter to the trend. A bull-flag triggers once the topside parallel of the pattern is broken, while a bear-flag triggers on a break of the underside parallel. For further confirmation, one can wait for the parallel to break and the most recent swing-high (for longs) or swing-low (for shorts) inside the formation.
Bull-flag in Uptrend (GBP/USD)
Bear-flag in Downtrend (GBP/JPY)
Trend Trading Strategy Checklist – 3 Tricks for Traders
Trend trading is one of the most popular ways to capture market price swings. With the right rules and approach, one can develop a solid way to take advantage of sustained trends. Here are three key steps:
- Learn to Identify and Measure Trends - Methods range from price action to moving averages to more sophisticated indicators derived from mathematical formulas. Two simple and robust ways involve observing basic price action and moving averages.
- Find Opportunities for Trend Trades that Others Don’t See - Look for pullback trading and continuation patterns. Triangles/wedges, rectangles, and bear/bull-flags are a few of the more popular continuation patterns.
- Understand the Pros and Cons of Trend Trading - One of the biggest advantages of trading trends can be the potential reward. Strong trends are known for lasting longer than most estimate. The drawback? Good trends aren’t frequent.
FAQs
Trend trading is a strategy that focuses on entering trades when prices are trending in one direction, identified by prices that are making higher highs and higher lows, or lower highs and lower lows.
The timeframe used depends on your trading style. Day traders should focus on shorter timeframes, such as 1-minute to hourly charts, whereas swing traders should focus on 4-hour to daily or even weekly charts.
This also depends on your trading style, but using moving averages that have interacted with prices in the past can offer more confidence that they will interact with prices going forward. However, market conditions are always changing, so you should regularly reassess which moving averages work best for current market conditions.
tastytrade, Inc. and TradingView, Inc. are separate and unaffiliated companies that are not responsible for each other’s services, products, and policies.
All investments involve risk of loss. Please carefully consider the risks associated with your investments and if such trading is suitable for you before deciding to trade certain products or strategies. You are solely responsible for making your investment and trading decisions and for evaluating the risks associated with your investments.