How to Trade the Cup and Handle Chart Pattern
The cup and handle is a bullish continuation pattern that forms when a security consolidates in a rounded trough followed by a brief pullback before breaking out to new highs. It appears across equities, futures, and ETFs on daily and weekly charts. This guide covers how to identify the pattern, measure price targets, confirm entries with volume, and manage the trade once positioned.
Technical analysis, including chart patterns, does not guarantee future results and is subject to failure in all market conditions. Past price patterns are not indicative of future performance. All trading involves risk of loss, including the possible loss of the entire amount invested. tastytrade does not provide investment advice. This content is for informational purposes only and should not be construed as a recommendation to buy or sell any security or enter into any particular trading strategy.
What the Cup and Handle Pattern Looks Like
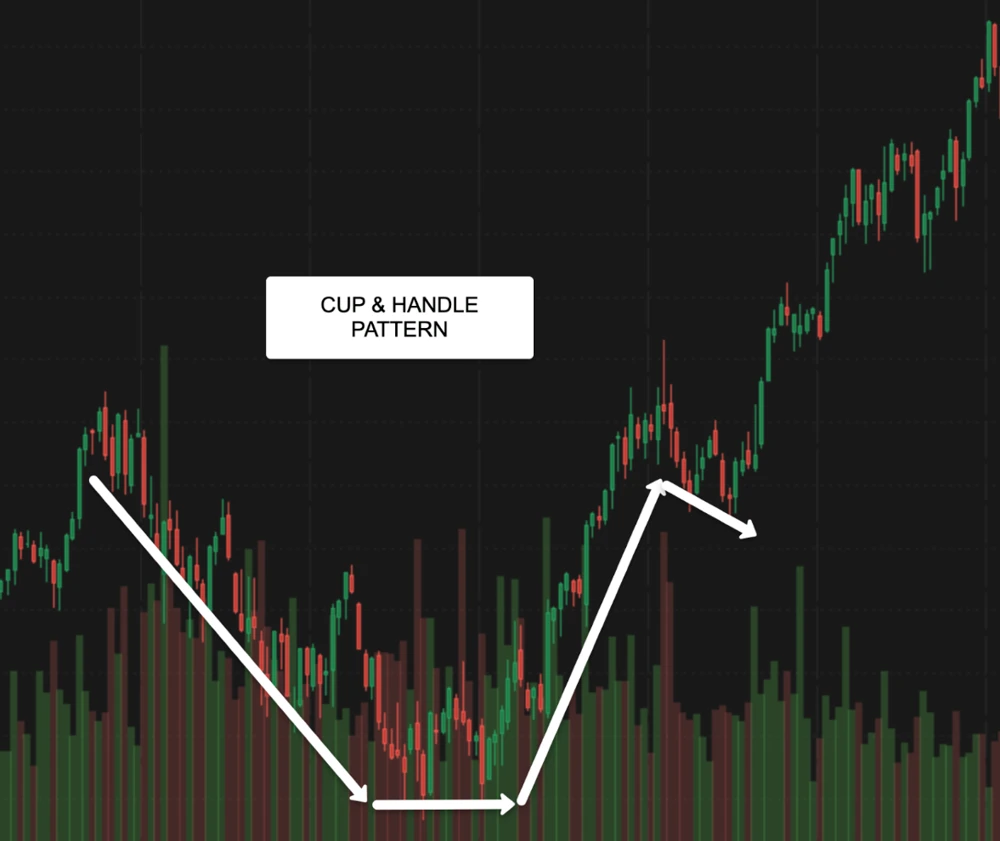
The pattern has two distinct components. The cup is a U-shaped consolidation that can span several weeks to several months on a daily or weekly chart. Price falls from a prior high, rounds out at the bottom without a sharp V-shape, and returns to near the prior high. The handle follows immediately after the lip of the cup and takes the form of a shallow, downward-drifting consolidation lasting one to four weeks. Volume typically contracts during the handle. The breakout occurs when price clears the resistance level defined by the cup's lip with a surge in volume.
Key structural requirements:
- The cup should be rounded, not V-shaped. A sharp V recovery suggests panic buying rather than orderly accumulation.
- The handle must form in the upper half of the cup. A handle that dips below the midpoint of the cup typically invalidates the pattern.
- Handle depth is generally 10% to 33% of the cup's height. Deeper corrections weaken the setup.
- The prior trend before the cup forms should be upward. This is a continuation pattern, not a reversal pattern.
How to Measure the Price Target
The conventional method for projecting a price target is to measure the depth of the cup and add that distance to the breakout point.
Component | Description | Example |
|---|---|---|
Cup high (resistance) | The level the cup must recover to | $150 |
Cup low | The lowest point of the rounded base | $120 |
Cup depth | Resistance minus cup low | $30 |
Breakout point | The resistance level cleared on the breakout | $150 |
Price target | Breakout point plus cup depth | $180 |
Component | Description |
|---|---|
Cup high (resistance) | The level the cup must recover to |
Cup low | The lowest point of the rounded base |
Cup depth | Resistance minus cup low |
Breakout point | The resistance level cleared on the breakout |
Price target | Breakout point plus cup depth |
Component | Example |
|---|---|
Cup high (resistance) | $150 |
Cup low | $120 |
Cup depth | $30 |
Breakout point | $150 |
Price target | $180 |
This is a measured move projection, not a guaranteed outcome. Targets can be adjusted based on nearby supply zones, prior highs, or round number resistance.
Volume Confirmation
Volume behavior is one of the most important filters for this pattern. During the cup's right side, volume should be lighter than on the left side. During the handle, volume contracts further as sellers exhaust themselves. On the breakout, volume expands sharply, ideally to at least 50% above the average daily volume. A breakout on thin volume has a higher rate of failure and may represent a false breakout.
Traders monitoring real-time data can set a volume alert at the cup's lip and wait to see volume confirmation before entering. Entering without volume confirmation exposes the trade to immediate rejection at resistance.
Entry, Stop, and Position Sizing
Entry
The standard entry is a buy on the close of the breakout candle or a stop order placed just above the cup's lip. Intraday entries carry more noise; daily and weekly chart setups offer cleaner signal. For traders using options, a long call or call spread can be structured to define risk while capturing the directional move.
Stop Placement
The most common stop location is below the low of the handle. This defines the risk on the trade and keeps the stop within the structure of the pattern. A close back inside the handle after the breakout is typically the technical invalidation signal. Some traders place the stop below the midpoint of the cup if they require more room, but the wider stop must be reflected in reduced position size.
Position Sizing
Risk should be defined before entry. With the stop placed below the handle low, the dollar distance from entry to stop determines the maximum shares or contracts for a given risk allocation. For example, if the entry is $152, the stop is $146, and the max risk per trade is $600, the position size is 100 shares ($600 / $6 risk per share). Increasing size beyond that to recover losses or to "be right" is outside the mechanics of this setup.
How to Trade the Cup and Handle on the tastytrade Platform
tastytrade's desktop platform is designed for options and multi-leg strategies, but equity breakout setups are fully executable. To view the setup:
- Open the Trade tab and search for the underlying.
- Switch to Chart view to pull up a daily or weekly candlestick chart.
- Draw the cup's resistance level using the horizontal line tool to mark the breakout trigger.
- To set up an entry price, stop loss, and profit target for a stock trade, use the bracket order feature.
- Review commissions and fees before submitting. Equity trades on tastytrade are $0 to open and $0 to close.
For options-based expressions of this pattern, a long call or a defined-risk call spread on the underlying allows for directional exposure with capped downside. Review the pricing and fees page for options commissions. Options cost $1.00 per contract to open and $0 to close.
Common Mistakes When Trading the Cup and Handle
Entering Before the Breakout
Anticipating the breakout by buying inside the handle before price clears resistance means entering when the pattern has not yet confirmed. Many handles fail and resolve lower. Waiting for a confirmed close above the cup's lip on volume reduces the false signal rate.
Ignoring the Prior Trend
The cup and handle is a continuation pattern. When it appears after a prolonged downtrend or in a deteriorating sector, the structural context works against the setup. The pattern performs best when the broader trend is up.
Holding Through a Retest Without a Plan
After the initial breakout, many securities will pull back to test the former resistance level as support. This is normal price behavior. Traders without a plan often exit on the retest and miss the continuation. Defining the invalidation level in advance separates a retest from a failed breakout.
Cup and Handle vs. Inverted Cup and Handle
The inverted cup and handle is the bearish mirror image of the pattern. Price consolidates in an inverted U-shape and breaks down below the support defined by the cup's base. The same volume and measurement mechanics apply in reverse.
Feature | Cup and Handle | Inverted Cup and Handle |
|---|---|---|
Direction | Bullish continuation | Bearish continuation |
Prior trend | Uptrend | Downtrend |
Cup shape | Rounded base (U) | Rounded top (inverted U) |
Handle | Downward drift after cup lip | Upward drift after base |
Breakout direction | Above resistance | Below support |
Volume on breakout | Expanding | Expanding |
Feature | Cup and Handle |
|---|---|
Direction | Bullish continuation |
Prior trend | Uptrend |
Cup shape | Rounded base (U) |
Handle | Downward drift after cup lip |
Breakout direction | Above resistance |
Volume on breakout | Expanding |
Feature | Inverted Cup and Handle |
|---|---|
Direction | Bearish continuation |
Prior trend | Downtrend |
Cup shape | Rounded top (inverted U) |
Handle | Upward drift after base |
Breakout direction | Below support |
Volume on breakout | Expanding |
Applying the Pattern to Options and Futures
For traders using options on equities or ETFs, the cup and handle provides a directional thesis and a logical timeframe. A long call with a strike near the cup's lip, expiring 30 to 60 days out, captures the breakout move while defining maximum risk to the premium paid. A call spread reduces the capital outlay but caps the upside at the short strike.
For traders in futures, the same pattern appears on index futures (ES, NQ) and commodity futures. Position sizing on futures must account for contract multipliers and the higher notional exposure per contract. tastytrade's futures trading platform displays probability of profit on options positions natively, which is useful when structuring a defined-risk play on a futures breakout.
Limitations of the Pattern
The cup and handle, like all technical chart patterns, is descriptive, not predictive. The pattern identifies historical price structure and provides a framework for measuring potential price moves. It does not guarantee outcomes. Factors that frequently cause valid-looking cup and handle setups to fail include:
- Broad market deterioration that overwhelms individual security strength.
- Thinly traded securities where volume data is unreliable.
- Cup structures that take fewer than five weeks to form, which are more prone to failure.
- Handle formations that are too deep or that drift above the midpoint of the cup rather than below.
Combining the cup and handle with a broader stock chart patterns framework and a defined market bias improves the context for each setup.
FAQs
On daily charts, the cup typically forms over 7 to 65 weeks. Cups shorter than five weeks are generally considered too compressed to be reliable. The handle usually forms over one to four weeks. On weekly charts, the timeframe scales accordingly, making the pattern more applicable to position trades held over months.
The breakout candle should show volume at least 40% to 50% above the security's average daily volume. Volume contraction during the handle setup followed by a volume surge on the breakout is the classic confirmation sequence. A breakout on below-average volume should be viewed with caution and treated as unconfirmed until volume expands.
Yes. A long call with a strike near the breakout level and 30 to 60 days to expiration is a common structure. A long call spread reduces the capital at risk while defining both the max gain and max loss. Options on tastytrade cost $1.00 per contract to open and $0 to close, which affects the breakeven calculation on any long options position.
A double bottom pattern forms two distinct lows at approximately the same price level, connected by a recovery between them. The cup and handle base is rounded and more continuous, without the two discrete low points. Both are bullish patterns, but the double bottom is typically a reversal pattern appearing after a downtrend, while the cup and handle is a continuation pattern appearing after an uptrend.
A handle that breaks below the support level defined by its own low before clearing the cup's lip is a failed setup. Price closing back inside the handle after an initial breakout attempt is also a failure signal. The invalidation stop is placed below the handle low for this reason. A failed cup and handle does not automatically signal a short opportunity, but it does indicate the bullish structure has not held and the thesis is off.
This content, including the use of actual symbols, any visual display or other reference to product, type of investment, strategy, or service offered, is for educational and informational purposes only. It is not, nor is intended to be, trading or investment advice or a recommendation that any investment product or strategy is suitable for any person.
Past performance is not indicative of future results.