What Is EMA (Exponential Moving Average)?
The exponential moving average (EMA) is a trend-following technical indicator that gives more weight to recent price data than older data. Unlike a simple moving average, which treats every period equally, the EMA adjusts dynamically as new prices come in, making it more responsive to short-term price changes. This article covers how the EMA is calculated, how it compares to the SMA, the most common lookback periods, and how traders apply it to options, futures, and stock charts.
How the EMA Is Calculated
The EMA is built on a two-step process. First, a multiplier is derived from the chosen lookback period. Then that multiplier is applied iteratively to each new closing price.
The multiplier formula is:
Multiplier = 2 / (N + 1)
Where N is the number of periods. For a 9-period EMA, the multiplier is 2 / (9 + 1) = 0.20. For a 21-period EMA, it is 2 / (21 + 1) = approximately 0.0909.
Each new EMA value is then calculated as:
EMA = (Closing Price x Multiplier) + (Previous EMA x (1 - Multiplier))
The first EMA value in any series is typically seeded with a simple moving average of the first N periods. After that, each candle's closing price influences the EMA, with the most recent close weighted most heavily.
The practical effect: a 9-period EMA reacts quickly to price movement. A 200-period EMA moves slowly and filters out most short-term noise.
EMA vs. SMA: Key Differences
Both the EMA and the simple moving average (SMA) track average price over a set number of periods. The difference is weighting.
EMA | SMA | |
|---|---|---|
Weighting | Exponential—recent closes weighted more heavily | Equal—all closes treated the same |
Responsiveness | Higher—reacts faster to price changes | Lower—lags more on reversals |
Lag | Less lag than SMA of the same period | More lag |
Common Use | Trend direction, crossover signals, dynamic support/resistance | Baseline trend identification, longer-term context |
Sensitivity to Outliers | Higher | Lower |
EMA | |
|---|---|
Weighting | Exponential—recent closes weighted more heavily |
Responsiveness | Higher—reacts faster to price changes |
Lag | Less lag than SMA of the same period |
Common Use | Trend direction, crossover signals, dynamic support/resistance |
Sensitivity to Outliers | Higher |
SMA | |
|---|---|
Weighting | Equal—all closes treated the same |
Responsiveness | Lower—lags more on reversals |
Lag | More lag |
Common Use | Baseline trend identification, longer-term context |
Sensitivity to Outliers | Lower |
Neither is inherently better. Traders who want faster signals favor the EMA, whereas traders who want smoother, less noisy reads on trend tend to prefer the SMA. Many use both together on the same chart to compare short-term momentum against a longer-term baseline.
Common EMA Periods
Different lookback periods serve different analytical purposes. The most widely referenced:
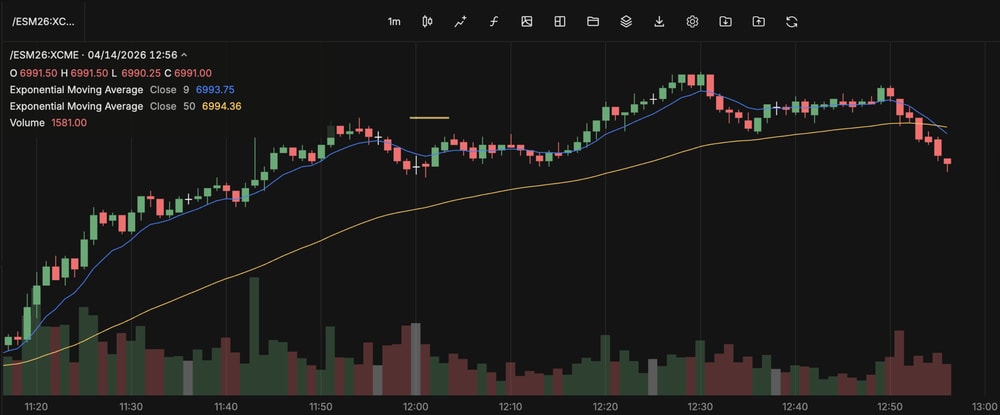
- 9 EMA — Very short-term. Used by active traders to track intraday and short-swing momentum. Stays close to price in trending conditions. Crosses price frequently in choppy markets.
- 21 EMA — Short-to-intermediate term. Commonly used alongside the 9 EMA to identify crossover signals. A 9 EMA crossing above the 21 EMA is read as a short-term bullish shift; crossing below is bearish.
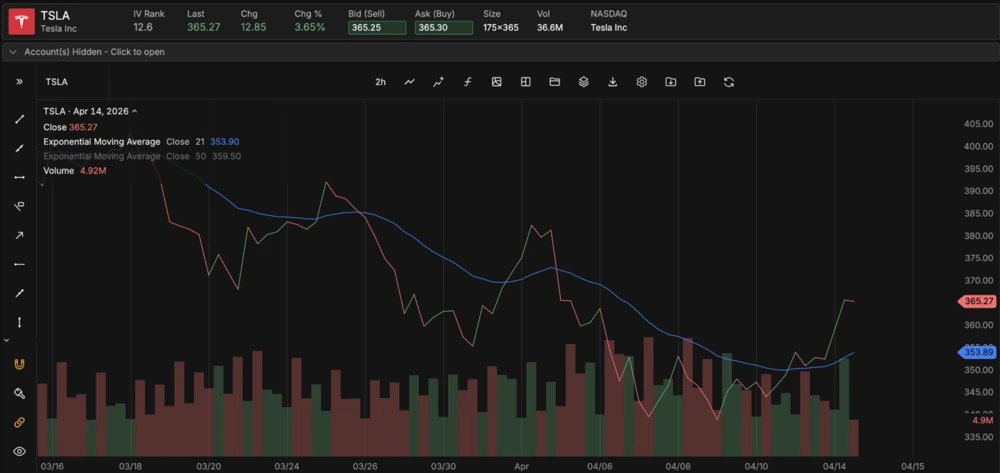
- 50 EMA — Intermediate term trend. Acts as a widely watched dynamic support or resistance level. When price holds above the 50 EMA across multiple sessions, it signals an established uptrend in the medium-term view.
- 100 EMA — Less common but used as a mid-point between the 50 and 200 for traders who want an additional layer of context.
- 200 EMA — Long-term trend. A widely referenced reference level in equities and futures. Traders monitor whether price is trading above or below the 200 EMA as a broad market structure read. The 200 EMA on a daily chart smooths out months of price data and changes slowly.
Period selection depends on the timeframe and trading style. A futures scalper watching 2-minute bars uses very different EMA settings than a swing trader analyzing daily closes.
How Traders Use the EMA
Trend Direction
When price is consistently trading above a rising EMA, the near-term trend is up. When price is below a declining EMA, the trend is down. This is the most basic application: using the EMA as a directional filter before entering a position.
A trader running index options strategies might check the 21 EMA on the daily SPX chart as a quick read on trend context before structuring a directional spread.
Crossovers
Two EMAs of different periods crossing each other generate signals. The most common configurations:
- 9/21 EMA crossover — Short-term signal. The 9 EMA crossing above the 21 EMA indicates near-term bullish momentum. The 9 EMA crossing below indicates bearish momentum.
- 50/200 EMA crossover (Golden Cross / Death Cross) — Longer-term signal. A 50 EMA crossing above the 200 EMA is called a Golden Cross. A 50 EMA crossing below the 200 EMA is called a Death Cross. These are widely covered in market commentary, though they are lagging by nature.
Crossovers are directional signals, not guarantees of price movement. All crossover signals carry risk of false positives in choppy, sideways markets.
Dynamic Support and Resistance
The EMA can be used as a floating support or resistance level. For example, in a strong uptrend, price might pulls back to the 21 EMA or 50 EMA before resuming higher. Traders watch these levels for potential pullback entries or exit points on existing positions.
As a Filter for Other Signals
Some traders use the EMA as a filter rather than a standalone signal. An example: only taking bullish trade setups when the underlying is above its 50 EMA, and bearish setups when below. This approach uses the EMA to align trade direction with the broader trend rather than trading against it.
EMA in the Context of Options and Futures Trading
For traders managing options positions on individual stocks or indices, the EMA provides directional context that can inform which strategies to deploy. A stock holding above a rising 50 EMA may present different opportunities than one that has broken below it.
For futures traders, the EMA is a standard tool on intraday charts. Active traders frequently use the 9 EMA and 21 EMA on short timeframes to track short-swing momentum.
The EMA is also used in conjunction with other indicators. Pairing it with the MACD (which is itself derived from EMA calculations) or with Bollinger Bands can provide layered confirmation before acting on a directional read.
Limitations of the EMA
The EMA is a lagging indicator. It uses historical price data, so it cannot predict future price movement. It describes what has happened, not what will happen.
In trending markets, the EMA tracks trend effectively, and crossovers can carry more signal weight. In choppy, range-bound markets, the EMA generates frequent crossovers that might produce false signals. Traders who rely solely on EMA crossovers in low-volatility, sideways markets tend to experience a high rate of failed signals.
The EMA does not account for volume, volatility, or fundamental factors, rather, it is a price-only tool. Using it alongside volatility-based indicators or volume analysis can reduce the signal noise problem.
Like all technical indicators, the EMA reflects market history and carries no predictive guarantee. Past price patterns do not ensure similar future outcomes.
FAQs
Neither is universally better. The EMA reacts more quickly to price changes and is preferred by traders who want faster signals or who are trading shorter timeframes. The SMA provides a smoother, more stable read and is preferred by traders focused on longer-term trends. Many traders use both on the same chart to compare short-term and long-term perspectives.
This content, including the use of actual symbols, any visual display or other reference to product, type of investment, strategy, or service offered, is for educational and informational purposes only. It is not, nor is intended to be, trading or investment advice or a recommendation that any investment product or strategy is suitable for any person.
Past performance is not indicative of future results.