The Complete Guide to RSI Divergence
 Published Aug 26, 2026
 Updated Aug 26, 2026
RSI divergence compares price momentum with price direction to identify when a trend may be losing strength or preparing to resume.
- Regular divergence can warn that an existing trend is weakening.
- Hidden divergence can support continuation in the direction of the larger trend.
- Divergence is more useful when price confirms with a break, reversal candle or change in market structure.
How RSI Works
The Relative Strength Index, or RSI, is a momentum oscillator developed by J. Welles Wilder Jr. It measures the size of recent gains relative to recent losses and plots the result on a scale from zero to 100. The standard setting uses 14 periods.
RSI above 70 is commonly described as overbought, while RSI below 30 is described as oversold. Those labels can be misleading when used alone. A strong market can remain above 70 while price continues rising. A weak market can remain below 30 while price continues falling. RSI is most useful when traders study its direction, range and relationship with price.
Divergence occurs when price and RSI stop moving together. Price may reach a new extreme while RSI fails to confirm it. That difference suggests the latest price move has less momentum than the prior move.
Regular Bullish Divergence
Regular bullish divergence forms when price makes a lower low but RSI makes a higher low. The market is still falling, but downside momentum has weakened. Sellers pushed price to a new low with less force than before.
Assume a stock falls to $370 and RSI reaches 24. The stock rebounds, then declines to $360 while RSI bottoms at 31. Price made a lower low, but RSI made a higher low. The divergence warns that the decline may be tiring.
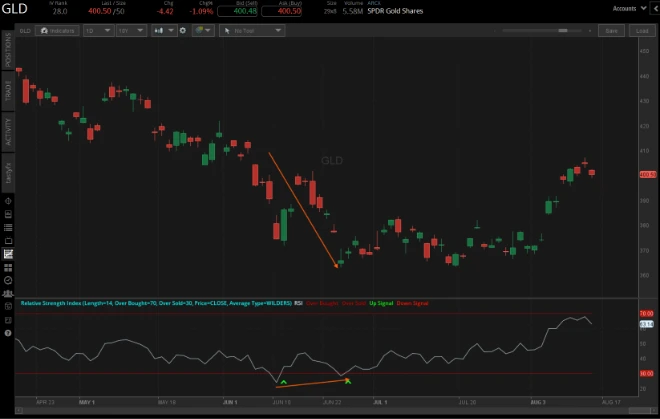
The divergence alone is not an entry. Price can continue falling while RSI improves. Traders often wait for confirmation, such as a close above a short-term swing high, a bullish reversal candle or a break of a descending trendline. The low that created the divergence can serve as a risk reference.
Regular Bearish Divergence
Regular bearish divergence forms when price makes a higher high but RSI makes a lower high. Price is still rising, but the latest advance has less momentum than the previous one.
Assume an index rallies to 30,000 with RSI at 78, pulls back, then rises to 31,000 with RSI at 69. The new price high is not confirmed by a new RSI high. Buyers are still lifting the market, but the rate of improvement has slowed.
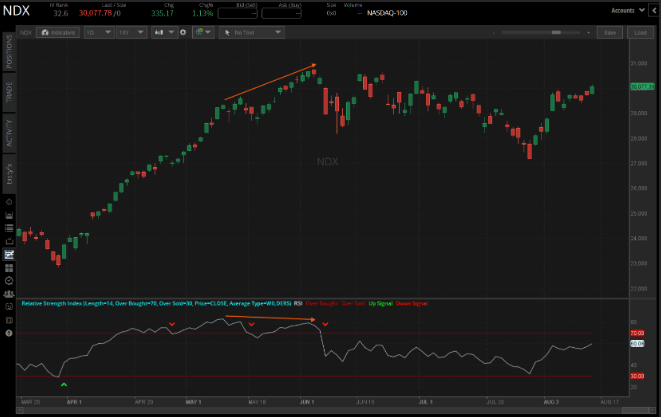
A trader may wait for price to break a nearby support level before taking a bearish position. The higher high can remain the invalidation point. In a strong bull market, bearish divergence can persist through several new highs, so early short positions can be expensive.
Hidden Divergence
Hidden divergence is usually interpreted as a continuation signal. Hidden bullish divergence forms when price makes a higher low while RSI makes a lower low. Price holds above its prior low even though momentum becomes more oversold. That can show that buyers are supporting the trend during a pullback.
Hidden bearish divergence forms when price makes a lower high while RSI makes a higher high. Momentum rebounds strongly, but price cannot recover its prior high. That can show that sellers remain in control during a countertrend rally.
These patterns work best when the larger trend is clear. A rising market with higher highs and higher lows provides the right setting for hidden bullish divergence. A falling market with lower highs and lower lows provides the right setting for hidden bearish divergence.
A Practical Trading Framework
Start by identifying the trend and the two price swings being compared. The swing points should be obvious on the chart. Connecting minor fluctuations can create false divergence because the comparison is arbitrary.
Next, compare the corresponding RSI peaks or troughs. For bullish divergence, compare price lows with RSI lows. For bearish divergence, compare price highs with RSI highs. The indicator and price should use the same time frame.
Then wait for price confirmation. A bullish setup may require a close above the high between the two lows. A bearish setup may require a close below the low between the two highs. This approach enters later but reduces the chance of trading against a trend that remains intact.
Finally, define invalidation and position size. A bullish divergence trade is usually invalidated below the second price low. A bearish divergence trade is usually invalidated above the second price high. Wider swing structures require smaller positions to keep dollar risk consistent.
Time Frames and Common Problems
Divergence appears on every time frame, from one-minute charts to monthly charts. Longer time frames generally contain more information and may produce more durable signals, but they also require wider stops and longer holding periods. Traders can use a higher time frame to establish the trend and a lower time frame to refine the entry.
One problem is confirmation bias. A trader who wants to call a top can usually find two RSI peaks that appear to diverge. Using clear swing points and a fixed process limits that discretion. Another problem is assuming RSI must reverse because it is overbought or oversold. Momentum extremes often confirm strong trends rather than end them.
Divergence is a warning about momentum, not a prediction with a deadline. Regular divergence tells traders to watch for a reversal. Hidden divergence tells traders to watch for trend continuation. Price still must confirm the trade.
FAQs
Regular divergence warns that an existing trend may be losing momentum and could reverse. Hidden divergence supports continuation of the larger trend, appearing during pullbacks within an established trend.
No. Divergence alone is not an entry signal. Traders typically wait for price confirmation, such as a close beyond a swing high or low, a reversal candle, or a trendline break, before acting.
The standard RSI setting uses 14 periods, measuring the size of recent gains relative to recent losses on a scale from zero to 100.
This content, including the use of actual symbols, any visual display or other reference to product, type of investment, strategy, or service offered, is for educational and informational purposes only. It is not, nor is intended to be, trading or investment advice or a recommendation that any investment product or strategy is suitable for any person.