What Is HMA (Hull Moving Average)?
 Published Aug 25, 2026
 Updated Aug 25, 2026
The Hull Moving Average is designed to follow price more quickly than a traditional moving average while keeping the line relatively smooth.
- The HMA combines weighted moving averages to reduce lag without creating an excessively noisy line.
- Traders often use the slope and direction of the HMA to identify trend changes.
- Fast response can improve timing, but it can also create false signals in sideways markets.
Why the Hull Moving Average was Created
Moving averages smooth price data so traders can see the underlying trend. That smoothing creates lag. A simple moving average may continue rising after price has already turned lower because older data remains in the calculation.
Alan Hull developed the Hull Moving Average, or HMA, to reduce that delay. The indicator uses weighted moving averages and a square-root adjustment to create a line that reacts quickly while remaining smoother than many short-term averages.
The HMA is not a forecast. It reorganizes past price data. Its benefit is visual and practical: trend changes can appear sooner than they would with a simple moving average using the same nominal period.
How the HMA is Calculated
The calculation has three steps. First, calculate a weighted moving average using half of the selected period. Second, calculate a weighted moving average using the full period. Third, subtract the full-period average from twice the half-period average, then smooth that result with a weighted moving average using the square root of the original period.
HMA = WMA of [2 x WMA(price, n/2) - WMA(price, n)] over sqrt(n)
Assume the selected period is 16. The calculation uses an eight-period weighted moving average, a 16-period weighted moving average and a final four-period weighted moving average because the square root of 16 is four. Recent prices receive greater weight than older prices throughout the process.
The formula sounds more complicated than its interpretation. When recent prices rise faster than the longer-term average, the HMA turns up quickly. When recent prices weaken, the HMA turns down quickly.
Reading the Slope
Traders commonly focus on the direction of the HMA. A rising HMA shows that recent weighted prices are advancing. A falling HMA shows that they are declining. A flat HMA indicates that the market lacks a clear directional trend.
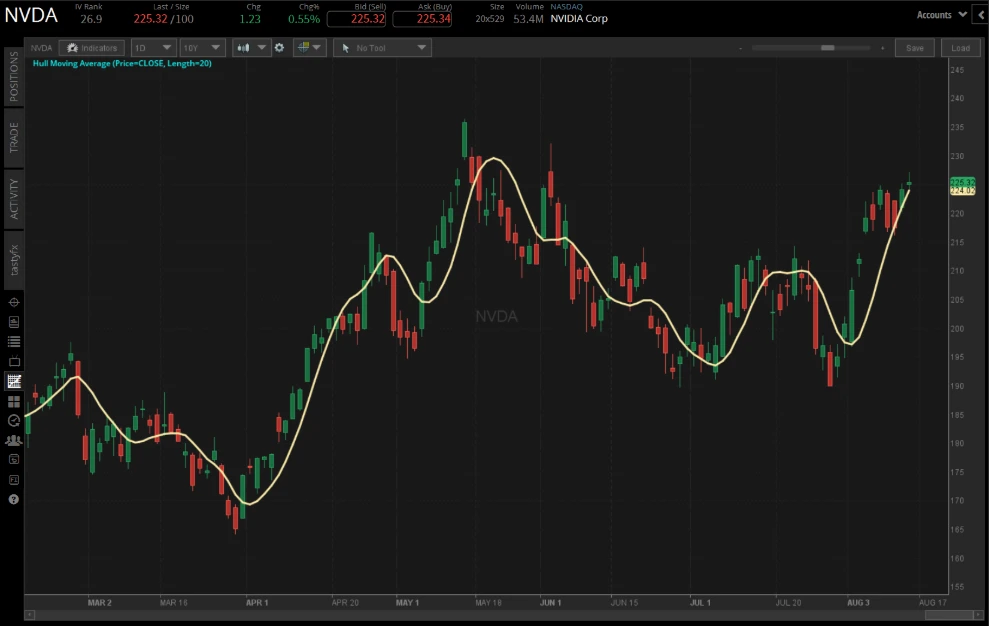
Some charting platforms change the line color when the slope changes. The color is only a visual shortcut. The underlying signal is whether the current HMA value is above or below the prior value.
The setup becomes stronger when the slope change agrees with price structure. An HMA turning higher as price breaks above a prior swing high offers more evidence than an isolated slope change inside a narrow range.
A Practical Example
Assume a futures contract has been declining for several sessions. Price then forms a higher low, breaks above a short-term resistance level and the 21-period HMA turns upward. A trader could enter after the breakout and use the higher low as the invalidation point.
The HMA helps with timing because it responds to the recent improvement. The price structure still defines the trade. If the contract falls below the higher low, the bullish setup has failed even if the HMA has not yet turned down.
Now assume the same contract is moving sideways in a tight range. The HMA may turn up and down several times as price crosses the middle of the range. Those signals create whipsaws because the indicator reacts quickly to movement that never develops into a trend. A trader can reduce that problem by requiring a range breakout, using a longer HMA period or filtering signals with a higher time frame.
HMA versus SMA and EMA
A simple moving average gives equal weight to every observation. An exponential moving average gives more weight to recent prices. The Hull Moving Average goes further by combining multiple weighted averages and emphasizing the difference between short-term and longer-term price behavior.
The HMA usually turns faster than an SMA and often appears smoother than an EMA with similar responsiveness. That does not make it universally better. A slower average may be preferable when a trader wants fewer signals and is willing to enter later. A faster average may be preferable when timing and tight risk control are more important.
Comparisons should use the same market and time frame. A 20-period HMA is not equivalent to a 20-period SMA in responsiveness. Traders should evaluate how each line behaves around the setups they trade.
Using the HMA in a Trading Plan
The HMA can serve as a trend filter, an entry trigger or a trailing reference. A trader may take long setups only when the HMA is rising. Another may enter when price closes above a rising HMA after a pullback. A trend follower may exit when the HMA turns down or when price closes below it.
No single rule removes false signals. Short periods react faster and whipsaw more often. Long periods react more slowly and miss more of the first move. The right setting depends on the product’s volatility and the trader’s holding period.
The HMA is most useful when its quick response is paired with market structure. The line can identify a change in momentum. Support, resistance and predefined risk determine whether that change offers a trade.
FAQ
A simple moving average weights all observations equally, which creates lag. The Hull Moving Average combines weighted moving averages and a square-root smoothing step to reduce that lag while keeping the line relatively smooth.
There is no single required period. Shorter periods react faster but produce more whipsaws in sideways markets, while longer periods react more slowly and miss more of an initial move.
No. The HMA reorganizes past price data to reduce lag. It does not forecast future prices, and its signals are typically used alongside price structure such as support, resistance and breakouts.
This content, including the use of actual symbols, any visual display or other reference to product, type of investment, strategy, or service offered, is for educational and informational purposes only. It is not, nor is intended to be, trading or investment advice or a recommendation that any investment product or strategy is suitable for any person.