Hammer Candlestick: What It Is and How to Use It
 Published Aug 20, 2026
 Updated Aug 20, 2026
What a Hammer Looks Like
A hammer is a single-candle pattern that can appear near the end of a decline. It has a small real body near the top of the candle, a long lower shadow and little or no upper shadow. The lower shadow is commonly at least twice the height of the real body.
The candle can close above or below its open. A green or bullish body may look stronger because buyers finished the period in control, but the color is less important than the shape and location. The long lower shadow records the key information: sellers drove price down, buyers responded and the market recovered most of the loss before the candle closed.
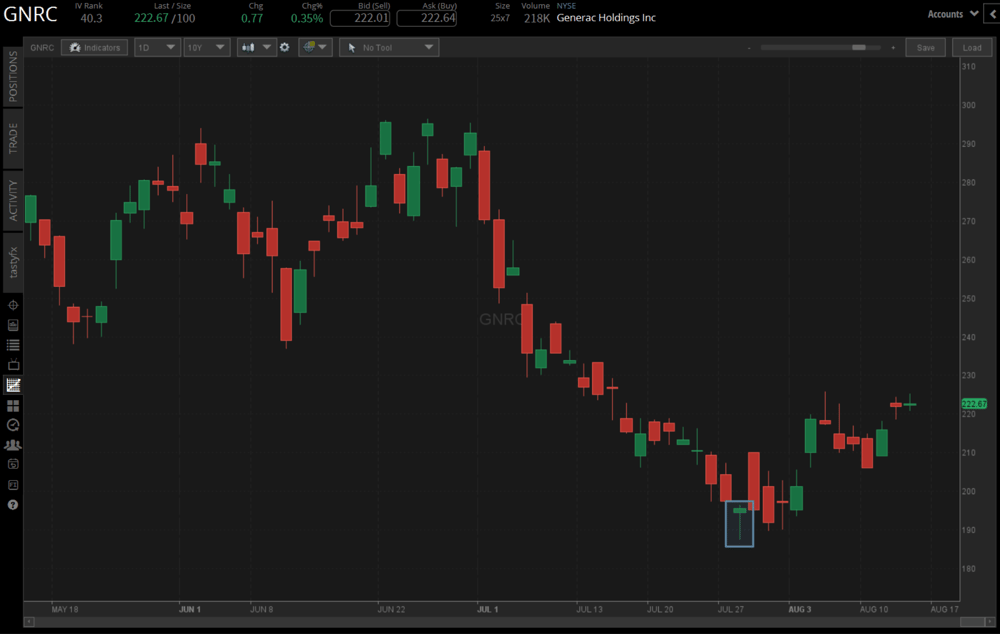
A candle with the same shape can be called a hanging man when it appears after an advance. The pattern name depends on trend context. A hammer is a potential bullish reversal pattern because it forms after weakness. A hanging man is a potential bearish warning because it forms after strength.
Why the Pattern Can Signal a Reversal
Every candle summarizes a short auction between buyers and sellers. In a hammer, sellers initially win. Price trades materially below the open and creates the long lower shadow. Buyers then absorb that selling and push price back toward the high of the period.
That recovery shows a change in intraperiod control, but it does not guarantee that the decline has ended. Sellers may return during the next candle. The pattern becomes more useful when it appears after an extended move, at prior support, near a major moving average or after price briefly breaks a well-watched low. Those locations give buyers a clearer reason to defend the market.
Confirmation and Entry Choices
Many traders wait for the next candle to confirm the hammer. A common confirmation signal is a close above the hammer high. That tells the trader that buying continued after the initial rejection. A more aggressive entry occurs near the hammer close, while a more conservative entry waits for the breakout.
The trade-off is price versus evidence. Entering near the close offers a better entry price and tighter distance to the hammer low, but the reversal has less confirmation. Waiting for a break above the high provides more evidence, but the trader enters later and may need a wider stop.
Volume can add useful context. A hammer that forms on unusually high volume may indicate forced selling, capitulation or aggressive dip buying. Low volume does not invalidate the pattern, but it offers less evidence that a meaningful transfer of control occurred.
A Practical Example
Assume a stock falls from $60 to $50 over two weeks. It opens one session at $50.50, sells off to $47.50, then rebounds and closes at $50.25. The candle has a small body near the top of the range and a $2.75 lower shadow. It also forms near a prior breakout level around $48.
A trader could wait for price to move above the hammer high at $50.75. An entry at $51 would confirm that buyers are following through. The hammer low at $47.50 provides a logical invalidation point because a move below that level would erase the rejection. The distance between entry and stop is $3.50 per share.
The trader then needs a target that justifies that risk. A prior congestion area near $57 would offer $6 of upside from a $51 entry. That is roughly 1.7 times the initial risk. The trader may decide that the reward is adequate, reduce position size because the stop is wide or pass on the trade if nearby resistance limits the upside.
Common Mistakes
The most common error is identifying every candle with a long lower shadow as a hammer. Location comes first. A hammer in the middle of a sideways range has less meaning because there was no established decline to reverse. A pattern that forms after one mildly weak candle also carries less information than one that follows persistent selling.
Another error is entering without defining invalidation. The long lower shadow can create a wide stop, especially in volatile stocks. Position size should reflect the distance to the hammer low. A trader who uses the same share count on every setup may take far more risk than intended.
Traders should also avoid treating the candle as a complete trading system. Earnings, economic releases and overnight gaps can overwhelm the pattern. Trend, support, volume and the broader market environment help determine whether the rejection has a reasonable chance of holding.
A hammer identifies a moment when sellers lost control of the low. Confirmation determines whether buyers can extend that change. Risk below the candle keeps a failed reversal from becoming an open-ended loss.
FAQs
A hammer forms after a decline and is read as a potential bullish reversal signal. The same shape after an advance is called a hanging man and is read as a potential bearish signal instead.
The lower shadow is commonly at least twice the height of the real body, with little or no upper shadow present.
Many traders wait for the next candle to close above the hammer high before entering, since this shows that buying continued after the initial rejection.
This content, including the use of actual symbols, any visual display or other reference to product, type of investment, strategy, or service offered, is for educational and informational purposes only. It is not, nor is intended to be, trading or investment advice or a recommendation that any investment product or strategy is suitable for any person.