What Are Bollinger Bands?
 Published Aug 17, 2026
 Updated Aug 20, 2026
What Are Bollinger Bands?
The indicator shows when price is moving far from its recent average, but traders still need context before treating the bands as a signal on their own.
How Bollinger Bands are Built
Bollinger Bands are a volatility-based technical indicator developed by John Bollinger. The standard version uses three lines: a 20-period simple moving average in the middle, an upper band two standard deviations above that average and a lower band two standard deviations below it.
The formula is straightforward. The middle band is the 20-period simple moving average. The upper band equals the moving average plus two standard deviations. The lower band equals the moving average minus two standard deviations. Standard deviation measures how widely prices have been distributed around the average. When price movement becomes more volatile, the bands expand. When trading becomes quieter, the bands contract.
The 20-period and two-standard-deviation settings are defaults, not permanent rules. A day trader may use the indicator on five-minute bars. A swing trader may apply it to daily bars. A longer-term investor may use weekly data. Changing the lookback period changes both the average and the volatility estimate, so traders should test a setting against the product and holding period they actually trade.
What a Band Touch Means
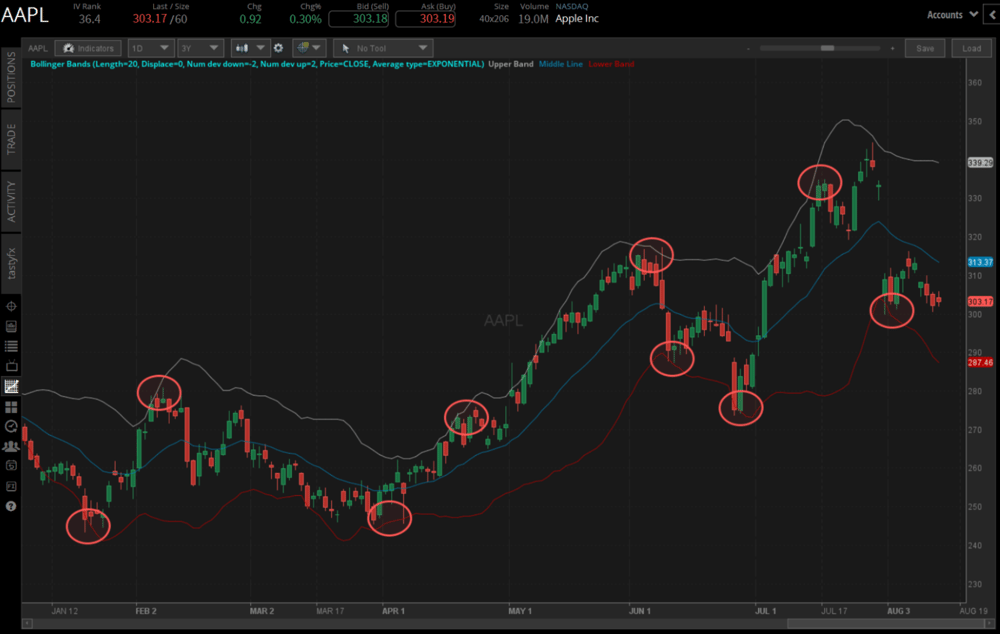
Price reaching a band means it has moved toward the outer edge of its recent distribution. It does not mean the market is objectively expensive or cheap. Strong trends can remain near one band for a long time. During an uptrend, price may repeatedly touch or move along the upper band as buyers continue to pay higher prices. During a downtrend, price may stay close to the lower band as sellers remain in control.
That is why a trader should consider avoiding selling solely because price touches the upper band or buying solely because it touches the lower band. The better question is how price behaves after reaching the band. A close outside the upper band followed by another strong close can confirm momentum. A brief move outside the band followed by a close back inside can suggest rejection. The same logic applies in reverse at the lower band.
The Bollinger Band Squeeze
Band width can be as useful as the location of price. When the bands become unusually narrow, recent volatility has fallen. Traders often call this a Bollinger Band squeeze. Quiet conditions can persist, but a sustained compression frequently precedes a larger move because markets alternate between periods of contraction and expansion.
The squeeze does not predict direction. Price can break higher or lower. Traders usually combine the squeeze with another piece of information, such as a break of a defined range, a change in volume or a larger trend. A close above resistance while the bands begin to expand may support a bullish breakout. A close below support with expanding bands may support a bearish breakout.
A Practical Example
Assume a stock is trading at $100. Its 20-day simple moving average is $98, and the 20-day standard deviation is $3. With a two-standard-deviation setting, the upper band is $104 and the lower band is $92. Price at $100 is above its recent average but still inside the bands.
Now assume the stock rallies to $105 and closes above the upper band. A trader should look at the surrounding evidence. If the stock also breaks a multiweek high, volume increases and the bands begin widening, the move may represent trend acceleration. A momentum trader might enter above the breakout and use the former resistance area or the middle band as a risk reference.
If the stock trades to $105 intraday but closes at $102.50, the interpretation changes. Price rejected the area outside the upper band and returned to the prior range. A trader considering a short position could use the rejection high as an invalidation point, but the setup is stronger when the broader trend is weak or resistance is nearby.
Using Bollinger Bands in a Trading Plan
Bollinger Bands work best as a framework rather than a mechanical buy-and-sell system. The middle band can help traders judge trend direction. A rising middle band with price mostly above it favors bullish setups. A falling middle band with price mostly below it favors bearish setups. A flat middle band and frequent crossings suggest a range.
Traders should also define risk before entering. A breakout trade can fail quickly if price returns inside the prior range. A reversal trade can fail if price resumes walking the band. Consider setting stops beyond a level that proves the original idea wrong, not at an arbitrary distance from the entry.
The indicator organizes three pieces of information on one chart: average price, volatility and relative location. Its value comes from reading those pieces together. A band touch identifies an unusual move. Price structure and risk management determine whether that move can become a trade.
This content, including the use of actual symbols, any visual display or other reference to product, type of investment, strategy, or service offered, is for educational and informational purposes only. It is not, nor is intended to be, trading or investment advice or a recommendation that any investment product or strategy is suitable for any person.