Stock Fundamental Analysis & Metrics
Fundamental analysis is a method of evaluating a security's intrinsic value by examining underlying economic and financial factors, including earnings, revenue, profit margins, balance sheet strength, and valuation ratios like P/E and P/B. This article explains the core principles of fundamental analysis, how to read key financial statements, and how traders and investors use fundamental data to identify potentially undervalued or overvalued stocks.
When evaluating a stock, there can be many factors to consider other than just looking at its share price. This article will go over financial statements at a high level and the terms that are regularly used when describing profitability, return, cash flow, and value of a company's stock. Many of the metrics below are available in the Research tab of the tastytrade trading platform, so you can evaluate a stock or ETF from different angles when performing fundamental analysis.
What is Fundamental Analysis?
Fundamental analysis involves researching a company's financial health through various accounting metrics and financial ratios. Publicly traded companies that issue common stock must regularly publish their financial statements. The three most common financial statements that investors review are balance sheets, income statements, and statements of cash flow.
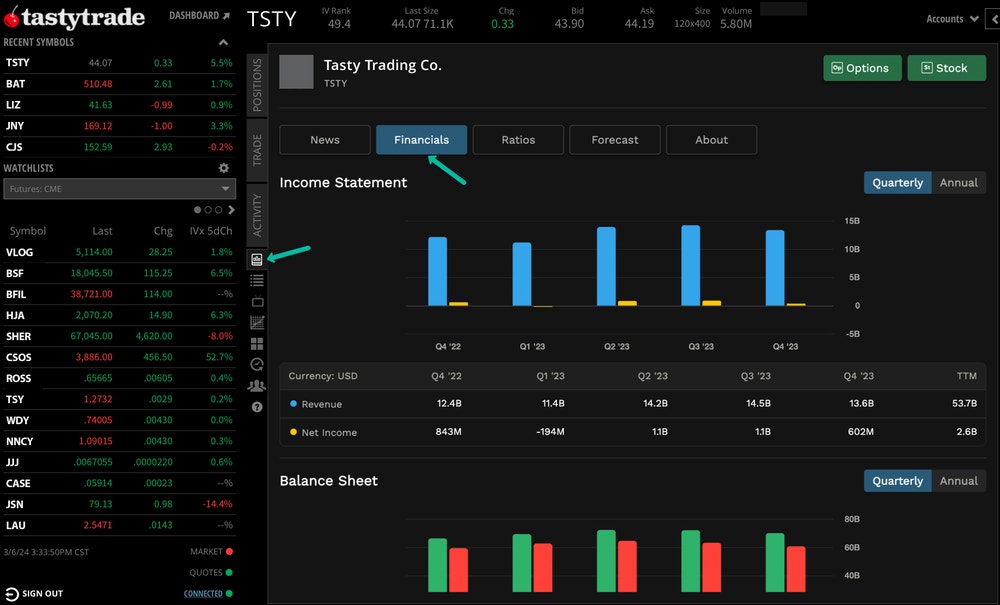
Balance Sheet
A balance sheet is a financial statement showing a company's assets, liabilities, and equity at a specific time. When looking at a balance sheet, assets equals liabilities plus stockholder's equity. The assets section includes what the company owns, while the liabilities section includes all the company's debts and obligations. The equity section shows how much money the company's owners have invested in the business, which includes shareholders. A balance sheet provides a snapshot of the company's finances and helps investors and analysts evaluate its financial health.
Income Statement
An income statement shows a company's revenue and expenses over a specific period. It reveals whether the company is profitable by subtracting the expenses from the revenue to determine the net income. Investors and analysts use the income statement to assess a company's financial health and profitability. Moreover, investors can compare a company's income statement to its competitors to determine whether it's a good investment opportunity.
Statement of Cash Flow
A statement of cash flow is a financial report that shows a company's cash inflows and outflows over a specific period. It reveals how much cash the company has generated. Investors can use the statement of cash flow to assess a company's liquidity or its ability to meet its financial obligations in the short term. It can also be used to evaluate the company's cash management practices and ability to generate cash from its operations.
Pros and Cons of Fundamental Analysis
There are many ways to analyze a stock to determine if it will be a good investment. One argument against fundamental analysis is that it is a lagging indicator, which means it is a data point published on historical data and is not current. On the contrary, advocates for fundamental analysis may argue that it can help identify companies that may be over or undervalued and whether they have the financial standings to withstand any economic shocks to perform well in the long term.
In the end, a market only works when it has varying opinions. While there are bulls and bears, investors can help derive the "truth" in many ways, whether solely through fundamental analysis or by combining other methods—such as technical analysis.
Common Metrics for Fundamental Analysis
When researching and deciding what to invest in, no "one metric" can define whether a stock is a sound investment. More importantly, each sector is different and has its own "normal" range and average, so it is crucial to note that comparing two companies from two separate sectors may not provide a sound "apples-to-apples" comparison. Instead, investors should consider various qualitative and quantitative factors, also known as due diligence. That said, some of the metrics below can help when deciding:
- Market Capitalization (Market Cap)
- Enterprise Value (EV)
- Price-to-Earnings (P/E) Ratio
- Price to Book (P/B) Ratio
- Cash Flow per Share
- Dividend per Share (Dividend/Share)
- Dividend Yield
- Return on Assets (ROA)
- Return on Equity (ROE)
- Price to Revenue per Share
Market Capitalization (Market Cap)
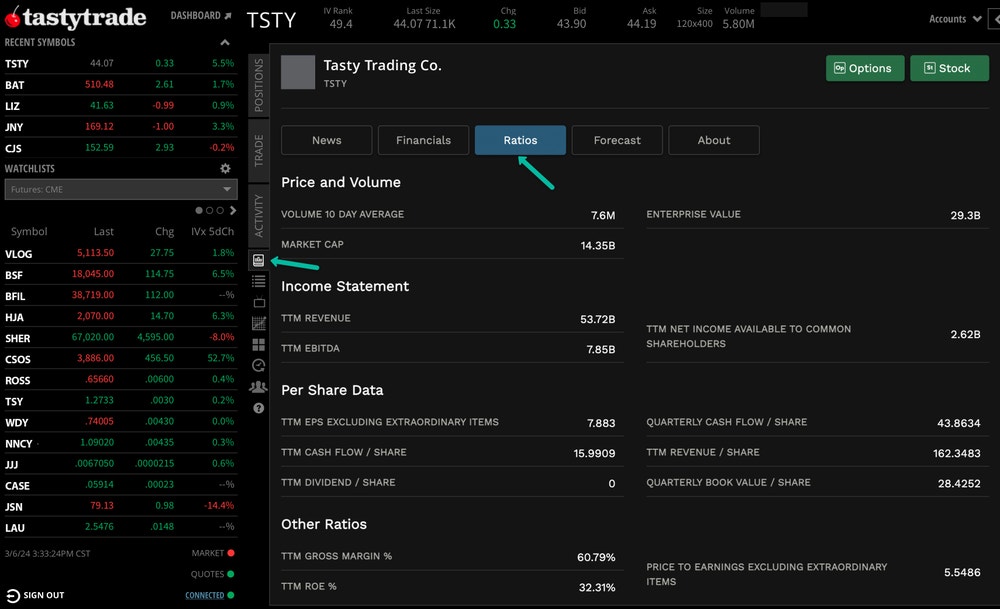
Market capitalization (market cap) refers to the total market value of a company. It is calculated by multiplying the current market price by the total number of shares outstanding. The share price of a stock does not represent a company's size. Instead, the market cap allows investors to compare the sizes of different companies. The market cap is one of many metrics available on the tastytrade trading platform to help with your research.
Market Cap | Company Size |
|---|---|
Micro Cap | Less than $250 million |
Small Cap | $250 million to $2 billion |
Mid Cap | $2 billion to $10 billion |
Large Cap | $10 billion to $200 billion |
Mega Cap | Greater than $200 billion |
Market Cap | Company Size |
|---|---|
Micro Cap | Less than $250 million |
Small Cap | $250 million to $2 billion |
Mid Cap | $2 billion to $10 billion |
Large Cap | $10 billion to $200 billion |
Mega Cap | Greater than $200 billion |
Companies are often grouped by their market cap when evaluating them to other industry peers or the broader market. They can fall under a specific category based on their total value or by market cap. Since they tend to be less diversified, micro and small cap stocks generally can exhibit more price volatility than their large or mega cap counterparts. For example, a company that has been around for a few decades with multiple lines of business could exhibit less price volatility during economic downturns when compared to a new small cap company that may not have various lines of business or a consistent history of profitability.
Investors can look up the market cap of any U.S. exchange-listed stock or ETF by referring to the quote details on all tastytrade platforms. Investors who like to track stocks on a watchlist can also view the market cap of every symbol displayed.
Market Cap Details | |
|---|---|
Tradable Products with Market Cap |
|
Market Cap Calculation | Total number of shares outstanding x market price of stock |
Platform Label | Market Cap (MkCap) |
Enterprise Value (EV)
Enterprise value (EV) measures the total value of a company by adding the current market cap plus total debt plus minority interest plus preferred stock minus cash and cash equivalents. It is often a metric used to measure a company's true value since it considers all stakeholders other than the value of its common stock (market cap). It can be helpful when comparing its value with others in the same industry. You can find the EV of stock in the Research tab on the tastytrade platform.
EV Details | |
|---|---|
Tradable Products with Enterprise Value |
|
Enterprise Value Calculation | Current market cap + total debt + minority interest + preferred stock - cash and cash equivalents |
Platform Label | Enterprise Value |
Price-to-Earnings (P/E) Ratio
The price-to-earnings (P/E) ratio, measures a company's stock price compared to its profitability. The P/E ratio is calculated by taking the stock's market price divided by earnings per share (EPS). P/E ratios can help investors determine whether a company's stock is over or undervalued and where it stands amongst industry peers.
Generally, each market sector has an average P/E ratio and can inform investors whether a stock is potentially under or overvalued compared to its industry peers. It is worth noting that the P/E ratio does not indicate a company's financial health since it usually excludes debts and other financial obligations. In short, P/E ratios help you understand how expensive or cheap a stock price is relative to the company's earnings. You can find the P/E ratio, on the Research tab of the tastytrade trading platform.
P/E Ratio Details | |
|---|---|
Tradable Products with a Price to Earnings (P/E) Ratio |
|
P/E Ratio Calculation | Stock price ÷ earnings per share (EPS) |
Platform Label | Price-to-Earnings Excluding Extraordinary Items (P/E Ratio) |
Price-to-Book (P/B) Ratio
Companies make money and profit using their assets, whether they offer tangible goods or an intangible service. The price-to-book (P/B) ratio measures a company's stock price compared to the value of a company's assets. The P/B ratio is calculated by taking the market capitalization and dividing it by the book value of a company's assets. Investors can also refer to a company's assets as their balance sheet. The P/B ratio is in the tastytrade trading platform to help you with your analysis.
P/B ratios can inform investors of the multiple they are paying for a company's assets in relation to a share of stock. As a result, a company with a high P/B may be making good use of its assets and growing, which the market may applaud with an appreciating share price. Conversely, a low P/B can infer that the company may not be utilizing its assets to their full potential, and as a result, the stock price may be trading near its book value, which usually occurs with a dwindling stock price. In short, the P/B ratio can help inform investors of the value a company creates with its assets to shareholders. You can find the price-to-book value on the Research tab of the tastytrade trading platform.
P/B Ratio Details | |
|---|---|
Tradable Products with a P/B Value |
|
P/E Value Calculation | Market capitalization ÷ value of a company's assets |
Platform Label | Price To Book Value |
Cash Flow per Share
Ever heard of the saying that someone is rich but cash poor? The same can apply to publicly traded companies since they can be cash poor despite having a large market cap. Cash flow per share can help inform investors of the amount of free cash flow (FCF) available on a per-share basis. Cash flow per share is represented on a dollar basis and measured quarterly. It is calculated by taking (cash flow from operations - preferred dividends, if applicable) ÷ (total number of shares outstanding). You can view the Trailing Twelve Month (TTM) Cash Flow / Share metric and other per share data of a company on the tastytrade trading platform.
Many of the financial ratios displayed in the Research tab on the tastytrade trading platform come from a company's financial statement. Investors can find a company's most recent financial statement by reviewing its quarterly or annual filing on their investor relations site. SEC Form 10-Q and 10-K are the forms companies must publish, which list their most recent quarterly or annual financial data, respectively.
Since it "takes money to make money," companies that generate sufficient FCF can reflect how efficiently a company generates revenue. Companies with high debt loads may have gains eroded by carrying costs associated with debt servicing, and this can lead to a low cash flow per share metric due to less capital efficiency. Conversely, a company with a high cash flow per share can indicate that it efficiently generates cash to sustain its operations without needing to tap debt. In short, factors other than debt levels and capital efficiency can affect a company's FCF.
The cash flow per share metric is widely tracked by dividend investors. Since dividend investors aim to target underlyings that pay a consistent and reliable stream of dividends, cash flow per share can help determine whether the dividend is at risk and can be maintained without negatively impacting the business. Cash flow per share can inform investors of a company's general cash flow health. Generally, a dividend-paying company facing any financial distress due to the lack of cash could reflect a low cash flow per share metric and have its dividend cut or eliminated.
Cash Flow per Share Details | |
|---|---|
Tradable Products with Cash Flow per Share |
|
Cash Flow per Share Calculation | Cash flow from operations - preferred dividends, if applicable ÷ total number of shares outstanding |
Platform Label | TTM Cash Flow / Share |
Dividend per Share (Dividend/Share)
Dividend per share is displayed as a dollar amount. As the name suggests, it represents the cash dividend it will or did distribute per share. A company that distributes dividends can pay them on an annual, quarterly, or monthly basis. Quarterly dividends are the most common for common stock. For example, a company declaring a $4 annual dividend, distributed quarterly, will show a $1 dividend per share based on its most recent distribution.
Generally, a company will announce how much it will pay annually. The frequency of how often a company or ETF pays out a dividend will determine how much the dividend will be. The tastytrade trading platform displays both so investors can research how much income they may receive annually or quarterly over a fiscal year.
A fiscal year is a company's "financial year." Most companies align their financial year with a calendar year, but it doesn't apply to all companies. When a company decides to pay a dividend, a fixed amount is usually paid evenly over a fiscal year, usually quarterly.
Although the total dollar amount can inform investors what they may receive if they are entitled to the dividend, the dividend yield is generally the metric that garners more attention as that can tell investors how much they could expect in return through dividends based on the market price of the stock.
It is important to note that dividend payment is not guaranteed, and the dividend distributions can vary for ETFs as the asset composition of an ETF can vary between distributions. As a result, determining the dividend per share for ETFs may be challenging. Investors can refer to prior distributions for a ballpark figure, but it is not always a reliable source due to the dynamic compositions of ETFs.
Dividend per Share Details | |
|---|---|
Tradable Products with Dividend per Share |
|
Dividend per Share Calculation | Total dividends declared ÷ total number of shares outstanding |
Platform Label | TTM Dividend / Share |
Dividend Yield
The relationship between a stock price and the dividend yield is an inverse relationship. The dividend yield measures the annual cash dividend paid per share on a percentage basis based on the market value of a stock. As a stock price increases, its dividend yield percentage will decrease, and vice versa. The tastytrade platform displays the dividend yield along with the dividend per share on the tastytrade trading platform.
For example, if the value of XYZ common stock is trading at $100 and pays a $5 annual dividend per share, its dividend yield is 5% ($5 ÷ $100). If XYZ increases to $110, the dividend yield will be 4.5% ($5 ÷ $110). Conversely, if XYZ drops to $90, the dividend yield will be 5.5% ($5 ÷ $90). The dividend yield is most often calculated from the closing price of the stock.
The dividend yield can help investors seek income (and potential stock price appreciation). It's important to note that the dividend yield on an ETF may not be as consistent as a company paying a dividend directly to shareholders since the composition of an ETF may change between each dividend distribution, which will affect the overall dividend yield.
Dividend Yield Details | |
|---|---|
Tradable Products with a Potential Dividend |
|
Dividend Yield Calculation | Annual dividend ÷ share price |
Platform Label | Dividend |
Return on Assets (ROA)
Return on assets (ROA) measures the profitability a company generates from its assets. ROA is calculated by taking a company's net income and dividing it by its total assets. Since a company's main objective is to maximize profits and returns for shareholders, ROA can measure how effectively a company generates profit from its assets.
Higher ROAs can indicate that a company is generating more profit per dollar value of assets. Conversely, a lower ROA may suggest that the company may not be as effective in generating a return from its assets.
ROA can be a helpful metric when weighing the overall profitability against other companies (e.g., car makers or athletic apparel brands). Many factors outside the products or services a company offers can affect a company's ROA. A company's management team can also play an integral part in effectively generating returns from its assets.
ROA Details | |
|---|---|
Tradable Products with a Potential ROA |
|
ROA Calculation | Net income ÷ total assets |
Return on Equity (ROE)
Return on equity (ROE) can measure how well a company can generate a return or profit based on a shareholder's investment. ROE is calculated by taking a company's net income and dividing it by shareholder's equity. The Trailing Twelve Month (TTM) ROE % and other financial ratios can be found on the tastytrade trading platform.
A company's net income refers to the money left over or the profit after deducting expenses, taxes, and interest (if applicable) from its revenue. By dividing a company's net income by its shareholder's equity, it measures how well a company generates a profit based on the funds provided by shareholders. A company with a high ROE may indicate that it effectively generates a larger profit per dollar of shareholder equity contributed. In contrast, a lower ROE can suggest that a company may not be using its equity efficiently to generate profits.
Like return on assets, ROE can also help measure a company's profitability, especially when comparing other companies within the same industry (e.g., an airline or a healthcare company), so it is essential to consider more than one factor when researching.
ROE Details | |
|---|---|
Tradable Products with Potential Return on Equity (ROE) |
|
ROE Calculation | Net income ÷ shareholder's equity |
Platform Label | TTM ROE % |
Price to Revenue Per Share
Price to revenue per share evaluates how much revenue a company generates per share of stock. It is calculated by dividing the total revenue by the share outstanding of the most recent fiscal year. Users can find the Trailing Twelve Month (TTM) Price to Revenue / Share and other financial ratios on the tastytrade trading platform.
Unprofitable companies (which may include early-stage tech companies, biotech companies, or other high-growth companies) that often have a negative price-to-earnings (P/E) ratio can use the price-to-revenue per share to check their overall performance. In short, early-stage companies that may not be profitable yet but are generating revenue may be an indication that the company is viable.
Moreover, the price to revenue per share can also indicate whether a company may be under or overvalued. A company with a low price to revenue per share may suggest that it is undervalued and vice versa. When evaluating a company by this metric, it is essential to consider other factors when determining its growth prospects, profitability, and industry trends.
Price to Revenue Per Share Details | |
|---|---|
Tradable Products with Price to Revenue per Share |
|
Price to Revenue / Share Calculation (Based on the most recent fiscal year figures) | TTM revenue ÷ total outstanding shares |
Platform Label | TTM Price to Revenue / Share |
All investments involve risk of loss. Please carefully consider the risks associated with your investments and if such trading is suitable for you before deciding to trade certain products or strategies. You are solely responsible for making your investment and trading decisions and for evaluating the risks associated with your investments.