Trading Guide: The Fundamentals of “Breakout Trading”
Range trading rests on the belief that “traders should sell high and buy low” as prices will stay flat over a period. In other words, “the range will hold.” Trend trading, on the other hand, is predicated on the idea that “traders should buy in the direction of momentum” as prices will continue to move in that direction for some time. In other words, “the trend will hold.”
At their core, range and trend trading believe that traders should “buy into support” or “sell into resistance.” Breakout trading takes the opposite approach. A breakout strategy focuses on selling once support is lost or focuses on buying once resistance is breached.
Breakout Trading is the Step In-Between Range and Trend Trading
‘Breakout’ trading is the strategy that connects ‘range’ and ‘trend’ trading. Ranges break out into trends; trends break out into ranges.
Both range and trend trading are tied together by the common belief that “price action will stay the same.”
Breakout trading takes the opposite approach that “price action will change,” the range will break, or the trend will change direction.
Example of Price Action Evolution: Bull Trend, to Range, to Bearish Breakout
One way to conceptualize the evolving relationship among trends, ranges, and breakouts is to review historical charts. One such example is the USD/JPY daily rate chart from 2018. For most of 2018, USD/JPY rates were rising at a steady clip, holding an uptrend from the March and August lows.
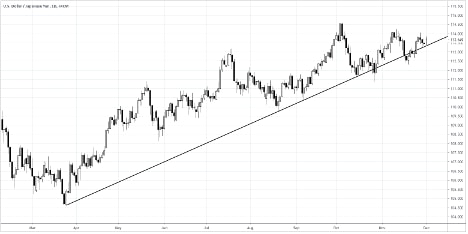
But by the end of October 2018, USD/JPY’s uptrend started to crack. Several tests below the uptrend between late-October and mid-November suggested that bullish momentum was starting to fade. Indeed, the subsequent swings to the topside in early- and late-November produced lower highs than in October.
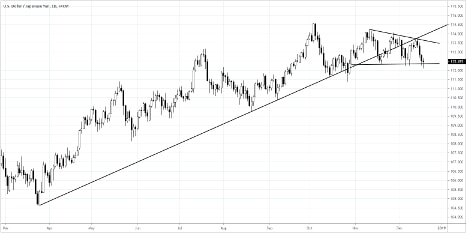
By December 2018, USD/JPY’s trend had given way and shifted into a sideways range. The attempted retest to climb back above the uptrend from the March and August 2018 swing lows was cut short; a failed retest of a trendline is often a strong indication that the trend has been negated.
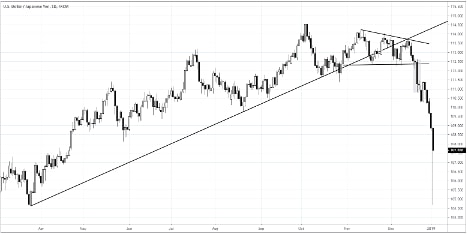
The sideways range failed in mid-December 2018, less than 24 hours after the Federal Reserve’s final policy meeting of the year. The bearish outside engulfing bar that formed on December 20 not only marked a break of the sideways range that began to form in early-November, but also saw the October monthly low broken; the series of higher highs and lower lows was officially busted. Soon after, the January 2019 Japanese yen flash crash saw the USD/JPY breakout drag prices back down towards their March 2018 low.
Identifying Breakout Patterns: Entry, Exit, and Order Type
Finding appropriate entry and exit points for breakout strategies, like any trading strategy, requires disciplined risk management. However, given the nature of breakout trading—waiting for trends to change or ranges to break—identifying levels pertinent to risk management may not be that difficult of an endeavor, even for new traders.
This means traders simply need to identify both resistance and support in a consolidation or a trend prior to looking for a breakout opportunity.
Entry
- Long position initiated with a ‘Buy Stop Entry Order’ above the range/trend resistance
- Short position initiated with a ‘Sell Stop Entry Order’ below the range/trend support
Timing the exit in a trade predicated on a breakout strategy can be done in three different ways.
Exit Method #1: Fixed Stop at Consolidation Resistance/Support
- If long on a bullish breakout, the ‘Sell Stop Loss Order’ is placed below the range/trend support
- If short on a bearish breakout, the ‘Buy Stop Loss Order’ is placed above the range/trend resistance
Exit Method #2: Fixed Stop at Breakout Candle High/Low
- If long on a bullish breakout, the ‘Sell Stop Loss Order’ is placed below the breakout candle low
- If short on a bearish breakout, the ‘Buy Stop Loss Order’ is placed above the breakout candle high
Exit Method #3: Trailing Stop
- If long on a bullish breakout, the ‘Trailing Stop Loss Order’ is placed below the range/trend support. As prices advance, the stop will be moved up at a fixed rate.
- If short on a bearish breakout, the ‘Trailing Stop Loss Order’ is placed above the range/trend resistance. As prices decline, the stop will be moved down at a fixed rate.
Identifying Breakout Patterns: Three Examples
Breakout trading strategies are often aimed at charts where there are chances of continuation, or, that prices will continue to move in the direction of the trend prior to entering the consolidation.
But for new traders, it's best to keep an open mind: approach consolidation patterns with a neutral perspective, allowing for outcomes on either side of support or resistance. Risk management is paramount.
To this end, there are three main patterns that traders should look for when scanning the charts for breakout trading opportunities: triangles/pennant; range/sideways consolidations; and head and shoulders/inverse head and shoulders.
1. Triangle/Pennant
Triangles and pennants, while different in form, are essentially the same in principle: a pause in a trend prior to continuation. Trends require at least two points of contact; triangles/pennants are characterized by at least four lower highs and higher lows (two to form support, two to form resistance) to mark the consolidation zone.
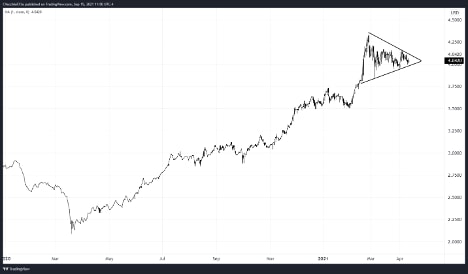
Between February and early April 2021, copper prices were trading in a triangle pattern, having entered the consolidation after rising in an uptrend for several months prior. The initial measured move called for a return to the apex of triangle resistance, to the February 25 high at 4.3755.
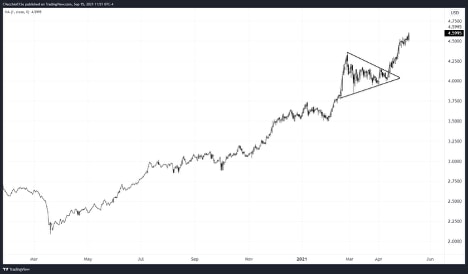
With copper prices trending higher prior to the consolidation, the expectation was for a bullish breakout from the triangle. In April 2021, copper prices broke above triangle resistance. The breakout’s initial measured move was achieved at 4.3755 by April 26, 2021.
2. Range/Sideways Consolidation
Ranges/sideways consolidations are also known as “horizontal trends,” insofar as they have points of contact forming resistance and support that are effectively equidistant; there are equal highs and equal lows. Ranges/sideways consolidations are effectively neutral consolidation patterns, with potential for continuation or reversal.
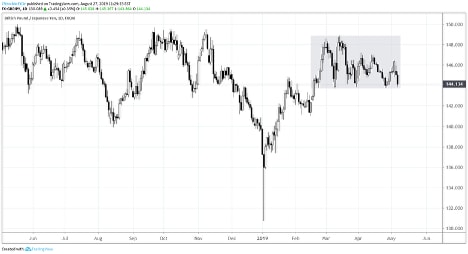
GBPJPY prices were consolidating between mid-February and early-May 2018, carving out a near-500-pip range/sideways consolidation. Unlike the DXY Index triangle example, which was defined by resistance with lower highs and support with higher low, the GBP/JPY sideways range is defined by near-equal highs and near-equal lows.
The bearish outside engulfing bar on May 8, 2018 marked the breakout from the range/sideways consolidation. The measured move for the consolidation (between 143.72 and 148.87, 515-pips) called for a drop down to 138.57. The measured move was achieved on May 29.
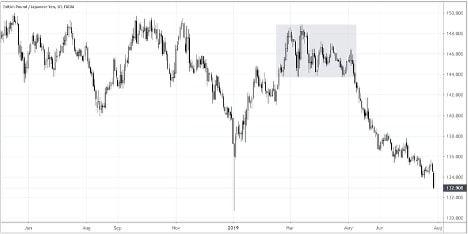
The GBP/JPY chart highlights why traders shouldn’t set an “absolute” limit on their targets; using a trailing stop, or only taking partial profit, would allow for traders to maintain positioning in the event that the trend were to continue. Indeed, the bearish breakout moved beyond the measured move; by the end of July 2019, GBP/JPY was trading below 133.00.
3. Head and Shoulders Pattern, Inverse Head and Shoulders Pattern
Head and shoulders patterns are reversal patterns, marking a top in prices. On the other hand, inverse head and shoulders patterns mark bottoms in price trends.
But these patterns do not need to form at the absolute highs and lows in trends. A head and shoulders pattern at the bottom is a bearish continuation pattern; an inverse head and shoulders pattern at the top is a bullish continuation pattern.
Both patterns are defined by three peaks in price action: the first and third peaks produce minor moves defining the “shoulders,” while the second peak produces the most extreme move and defines the “head.”
Both shoulders and the head will see their price moves retrace back to the same base, which is known as the “neckline.”
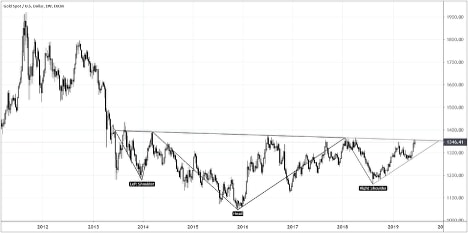
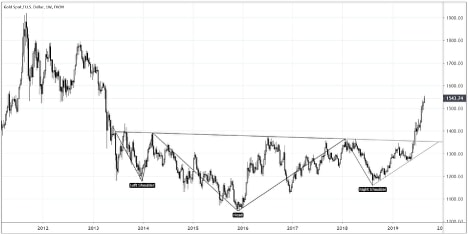
Looking at the gold price weekly timeframe, an inverse head and shoulders pattern at trend lows—a bottoming pattern—formed between early-2013 and mid-2019
The gold price rally in June 2019 marked the continuation of the bottoming effort after breaking the multi-year descending trendline from the 2011 high.
The turn lower at the end of 2018 appeared to be a right shoulder in a multi-year inverse head and shoulders pattern, with the head forming at the November 2015 low at 1046.23.
Ultimately, the placement of the neckline determines the final upside targets in a potential long-term gold price rally.
Conservatively, drawing the neckline breakout against the January 2018 high at 1365.95 calls for a final target of 1685.67. Aggressively, drawing the neckline breakout against the August 2013 high at 1433.61 calls for a final target at 1820.99.
Identifying Breakout Patterns: Finding Price Targets “Measured Moves”
Depending upon the type of consolidation pattern, the final price target for the breakout strategy will vary accordingly. Identifying a price target helps traders determine a minimum level they should expect the price to reach during a breakout and will help them to remain objective during periods of countertrend movement.
Traders can identify targets – the “measured move” – for breakouts in the following ways:
1. Triangles/Pennants
- Take the difference between the first support and resistance points that formed the triangle/pennant to find the measured move
- On a long position the initial target will be the price of the first point that formed resistance; the final target will be the measured move plus the bullish breakout price
- On a short position the initial target will be the price of the first point that formed support; the final target will be the bearish breakout prices minus the measured move
2. Ranges/Sideways Consolidations
- Take the difference between support and resistance to find the measured move
- On a long position, the final target will be the measured move plus the price of resistance
- On a short position, the final target will be the price of support minus the measured move
3. Head and Shoulders/Inverse Head and Shoulders Pattern
- Take the difference between the head and the neckline to find the measured move
- On a long position (inverse head and shoulders), the target will be the measured move plus the neckline bullish breakout price
- On a short position (head and shoulders), the target will be the neckline bearish breakout price minus the measure move
Using Volatility as a Filter
When trading stocks, bonds, commodities, or futures, market participants can monitor trading volumes. Operating through centralized exchanges, traders can use volumes to determine rates of participation underlying price action.
For example, imagine that a stock’s price has been consolidating in a sideways range marked by low volume. Then, when prices leave the range, volume increases dramatically. The higher rate of participation increases the likelihood that the breakout is valid. On the other hand, if volumes don’t rise during the breakout, the lack of participation decreases the likelihood that the breakout is valid.
Unfortunately for FX traders, there are no centralized exchanges. As such, there are no reliable measures of trading volumes that accurately capture positioning shifts in the market in real-time, unlike stocks, bonds, commodities, or futures. Instead, traders may want to monitor implied volatility instead of volume. Implied volatility measures capture the expected price range over a given period. A simple rule of thumb: when prices leave a consolidation, look for breakout confirmation by a rise in short-term (overnight and 1-week) implied volatility measures.
Pitfalls of Breakout Trading—The “False Breakout”
Trading breakouts, like any other strategy, does not guarantee profitable outcomes. Indeed, that is why there are false breakout strategies.
What is a “false breakout?” If a breakout occurs when a range’s or a trend’s support or resistance breaks, then a false breakout occurs when price action gives the appearance of a break from a range or trend, but price ultimately returns into said range or trend.
Here’s an example of a false breakout in USD/JPY in 2019:
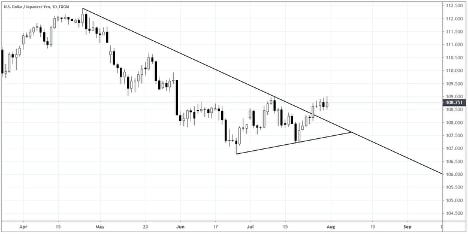
In July 2019, USDJPY rates attempted a bullish breakout from the downtrend from the April 24 and July 10 swing highs. Support had formed against the June 25 and July 18 lows.
However, five days after the bullish breakout attempt, USD/JPY rates could not clear the former swing high set on July 10. This was a warning sign to traders.
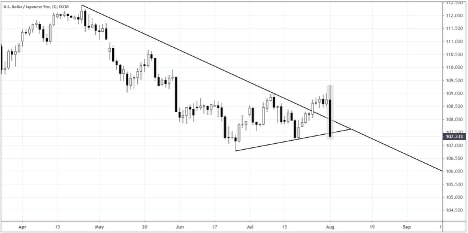
The false breakout was marked by a bearish outside engulfing bar on August 1 that saw USD/JPY rates return into the downtrend from the April 24 and July 10 swing highs.
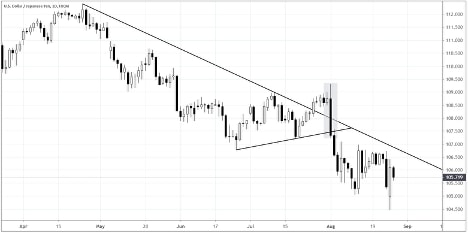
With USD/JPY rates also falling below the uptrend from the June 25 and July 18 lows, this was a clear false breakout. Less than one month later, USD/JPY rates had continued to trend low following the August 1 bearish outside engulfing bar.
Although traders may have initially taken the wrong side of the trade on the false bullish breakout attempt, prudent risk management may have minimized losses by quickly exiting the position and flipping to the short side.
Breakout Trading Strategy Checklist: 5 Steps for Traders
A quick recap: breakout trading strategies are the link between range and trending trading strategies; ranges breakout into trends; trends breakout into ranges. Here are the five things traders need to do in order to effectively run a breakout strategy:
- Find Opportunities for Breakout Trades – Look for triangles/pennants, ranges/sideways consolidations, and head and shoulders/inverse head and shoulders with clearly defined resistance and support in prices.
- Wait Patiently – Only take breakout trades when prices breach clearly defined resistance or support; for more conservative traders waiting for confirmation, this may include waiting for a retest of the breakout price level.
- Calculate the Measured Move – Once you’ve identified the breakout pattern candidate, find the appropriate measured move to determine the trade’s price target.
- Calculate the Risk – Always use stops. Fixed Stops or Trailing Stops are necessary in a breakout strategy in the event of a false breakout.
- Stay Objective – By defining your target and stop ahead of execution, traders can reduce the emotional influence of watching price action unfold in real-time. Once price targets and stops are determined, there’s no reason to risk capital with emotional reactions.
This content, including the use of actual symbols, any visual display or other reference to product, type of investment, strategy, or service offered, is for educational and informational purposes only. It is not, nor is intended to be, trading or investment advice or a recommendation that any investment product or strategy is suitable for any person.
Past performance is not indicative of future results.